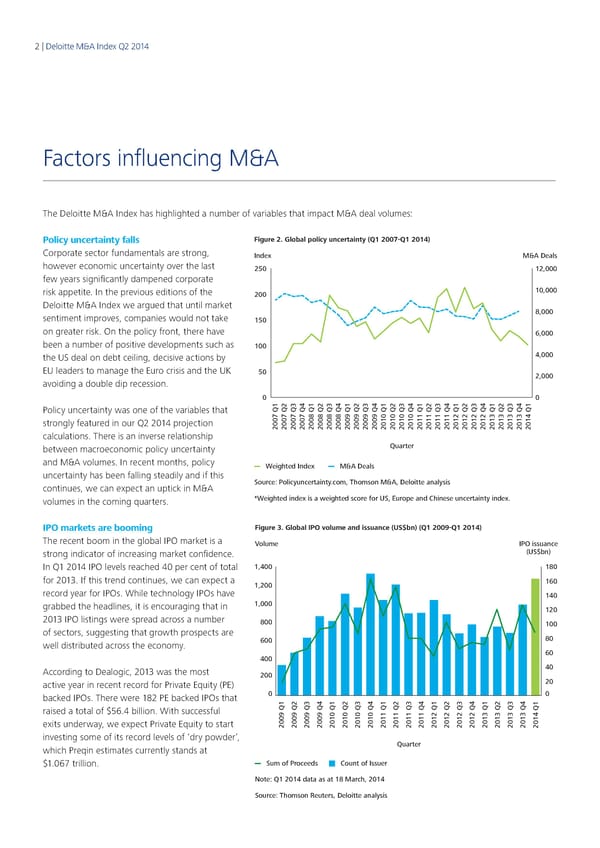
2 | Deloitte M&A Index Q2 2014 Factors influencing M&A The Deloitte M&A Index has highlighted a number of variables that impact M&A deal volumes: Policy uncertainty falls Figure 2. Global policy uncertainty (Q1 2007-Q1 2014) Corporate sector fundamentals are strong, Index M&A Deals however economic uncertainty over the last 250 12,000 few years significantly dampened corporate risk appetite. In the previous editions of the 200 10,000 Deloitte M&A Index we argued that until market 8,000 sentiment improves, companies would not take 150 on greater risk. On the policy front, there have 6,000 been a number of positive developments such as 100 the US deal on debt ceiling, decisive actions by 4,000 EU leaders to manage the Euro crisis and the UK 50 2,000 avoiding a double dip recession. 0 0 Policy uncertainty was one of the variables that strongly featured in our Q2 2014 projection 2007 Q12007 Q22007 Q32007 Q42008 Q12008 Q22008 Q32008 Q42009 Q12009 Q22009 Q32009 Q42010 Q12010 Q22010 Q32010 Q42011 Q12011 Q22011 Q32011 Q42012 Q12012 Q22012 Q32012 Q42013 Q12013 Q22013 Q32013 Q42014 Q1 calculations. There is an inverse relationship between macroeconomic policy uncertainty Quarter and M&A volumes. In recent months, policy Weighted Index M&A Deals uncertainty has been falling steadily and if this continues, we can expect an uptick in M&A Source: Policyuncertainty.com, Thomson M&A, Deloitte analysis volumes in the coming quarters. *Weighted index is a weighted score for US, Europe and Chinese uncertainty index. IPO markets are booming Figure 3. Global IPO volume and issuance (US$bn) (Q1 2009-Q1 2014) The recent boom in the global IPO market is a olume V IPO issuance strong indicator of increasing market confidence. (US$bn) In Q1 2014 IPO levels reached 40 per cent of total 1,400 180 for 2013. If this trend continues, we can expect a 1,200 160 record year for IPOs. While technology IPOs have 140 grabbed the headlines, it is encouraging that in 1,000 120 2013 IPO listings were spread across a number 800 100 of sectors, suggesting that growth prospects are 80 well distributed across the economy. 600 60 400 According to Dealogic, 2013 was the most 40 200 active year in recent record for Private Equity (PE) 20 backed IPOs. There were 182 PE backed IPOs that 0 0 raised a total of $56.4 billion. With successful exits underway, we expect Private Equity to start 2009 Q12009 Q22009 Q32009 Q42010 Q12010 Q22010 Q32010 Q42011 Q12011 Q22011 Q32011 Q42012 Q12012 Q22012 Q32012 Q42013 Q12013 Q22013 Q32013 Q42014 Q1 investing some of its record levels of ‘dry powder’, which Preqin estimates currently stands at Quarter $1.067 trillion. Sum of Proceeds Count of Issuer Note: Q1 2014 data as at 18 March, 2014 Source: Thomson Reuters, Deloitte analysis
 Q2 2014 The Deloitte M&A Index Page 1 Page 3