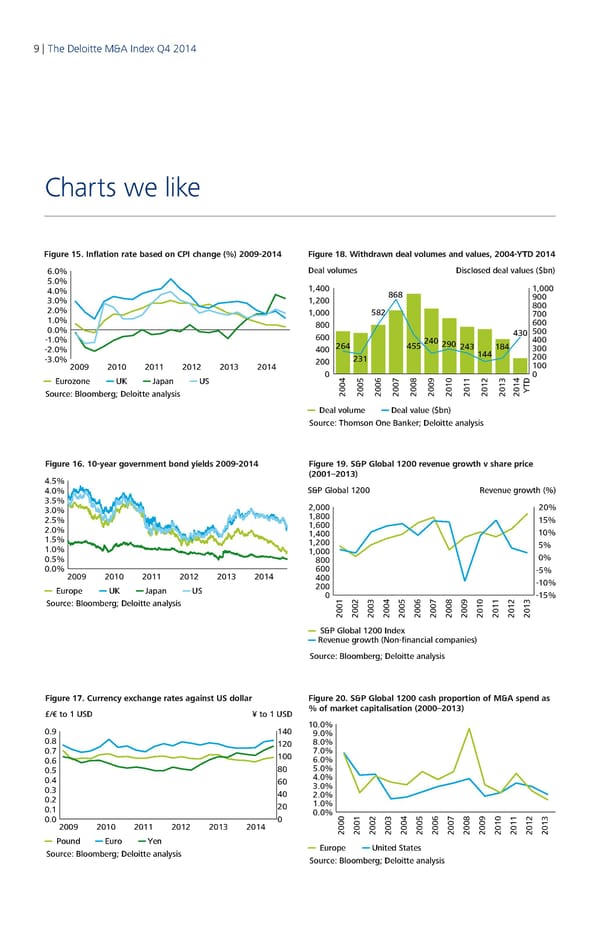
9 | The Deloitte M&A Index Q4 2014 Charts we like Figure 15. Inflation rate based on CPI change (%) 2009-2014 Figure 18. Withdrawn deal volumes and values, 2004-YTD 2014 6.0% Deal volumes Disclosed deal values ($bn) 5.0% 1,400 1,000 4.0% 868 900 3.0% 1,200 800 2.0% 1,000 582 700 1.0% 800 600 0.0% 430 500 -1.0% 600 240 290 400 -2.0% 400 264 455 243 184 300 -3.0% 231 144 200 2009 2010 2011 2012 2013 2014 200 100 Eurozone UK Japan US 0 4 5 6 7 8 9 D0 Source: Bloomberg; Deloitte analysis 200 200 200 200 200 200 20102011 201220132014YT Deal volume Deal value ($bn) Source: Thomson One Banker; Deloitte analysis Figure 16. 10-year government bond yields 2009-2014 Figure 19. S&P Global 1200 revenue growth v share price 4.5% (2001–2013) 4.0% S&P Global 1200 Revenue growth (%) 3.5% 2,000 20% 3.0% 1,800 2.5% 1,600 15% 2.0% 1,400 10% 1.5% 1,200 5% 1.0% 1,000 0.5% 800 0% 0.0% 600 -5% 2009 2010 2011 2012 2013 2014 400 -10% Europe UK Japan US 200 0 -15% Source: Bloomberg; Deloitte analysis 2001200220032004200520062007200820092010201120122013 S&P Global 1200 Index Revenue growth (Non-financial companies) Source: Bloomberg; Deloitte analysis Figure 17. Currency exchange rates against US dollar Figure 20. S&P Global 1200 cash proportion of M&A spend as £/€ to 1 USD ¥ to 1 USD % of market capitalisation (2000–2013) 0.9 140 10.0% 9.0% 0.8 120 8.0% 0.7 0 7.0% 0.6 10 6.0% 0.5 80 5.0% 0.4 60 4.0% 0.3 3.0% 0.2 40 2.0% 0.1 20 1.0% 0.0 0 0.0% 0 1 2 3 4 5 6 3 2009 2010 2011 2012 2013 2014 200 200 200 200 200 200 200200720082009201020112012201 Pound Euro Yen Europe United States Source: Bloomberg; Deloitte analysis Source: Bloomberg; Deloitte analysis
 Q4 2014 The Deloitte M&A Index Page 8 Page 10