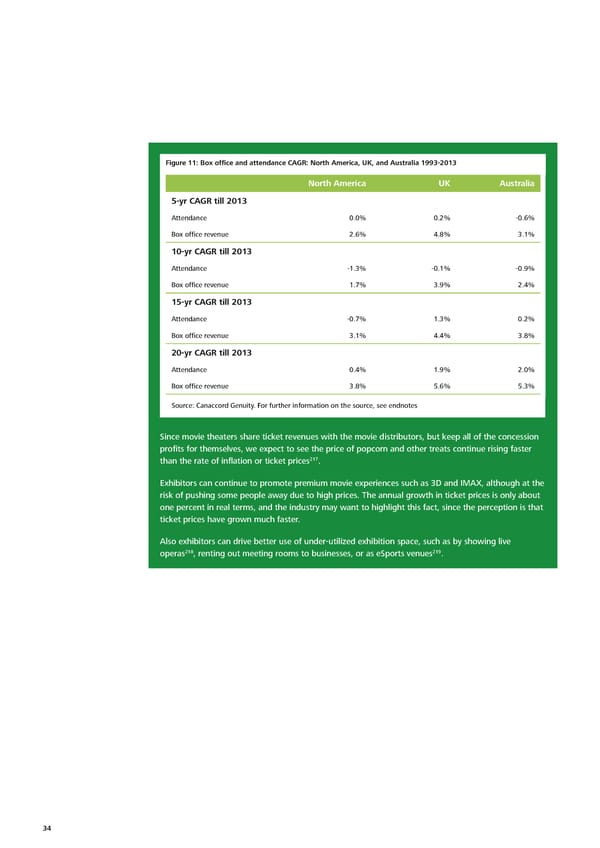
Figure 11: Box office and attendance CAGR: North America, UK, and Australia 1993‑2013 North America UK Australia 5‑yr CAGR till 2013 Attendance 0.0% 0.2% -0.6% Box office revenue 2.6% 4.8% 3.1% 10‑yr CAGR till 2013 Attendance -1.3% -0.1% -0.9% Box office revenue 1.7% 3.9% 2.4% 15‑yr CAGR till 2013 Attendance -0.7% 1.3% 0.2% Box office revenue 3.1% 4.4% 3.8% 20‑yr CAGR till 2013 Attendance 0.4% 1.9% 2.0% Box office revenue 3.8% 5.6% 5.3% Source: Canaccord Genuity. For further information on the source, see endnotes. Since movie theaters share ticket revenues with the movie distributors, but keep all of the concession profits for themselves, we expect to see the price of popcorn and other treats continue rising faster 217 than the rate of inflation or ticket prices . Exhibitors can continue to promote premium movie experiences such as 3D and IMAX, although at the risk of pushing some people away due to high prices. The annual growth in ticket prices is only about one percent in real terms, and the industry may want to highlight this fact, since the perception is that ticket prices have grown much faster. Also exhibitors can drive better use of under-utilized exhibition space, such as by showing live 218 219 operas , renting out meeting rooms to businesses, or as eSports venues . 34
 Technology, Media & Telecommunications Predictions Page 40 Page 42