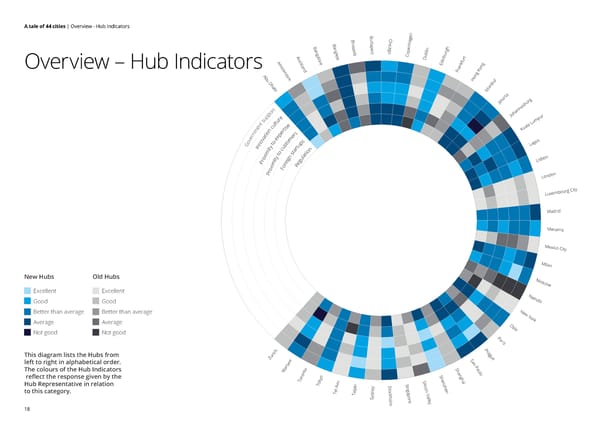
A tale of 44 cities | Overview - Hub Indicators B en B ud hC g B r a i a u p c h B a s e a n a n s s g e n h n g e t o p li g k l r g o s o b u Au alo k C Du b t A ck re din m la E ng Overview – Hub Indicators s n t d o e Frankfur K r d g A am n bu o l D H bu ha n bi a st I rta a g k r Ja t nesbu r an o oh p J r p e u u r p s u um t L t l la n u e a e c s i Ku n t m r n o e s i p r r t x e e a e v v m s os o o o o g n t t p La G n s u I y u t t r i c a n t o m o s i i t t x a o y n l bon t g u s r i i i P e g L m r e i o R x F o r n P do n Lo y t Ci g r u bo m xe u L adrid M M an am a M exi co C i ty M il an New Hubs Old Hubs M osc ow Excellent Excellent N ai r ob Good Good i Better than average Better than average New Y or Average Average O k s Not good Not good lo Pa ris h Pr This diagram lists the Hubs from ric ag u u Z w Sa e left to right in alphabetical order. a o S Pa The colours of the Hub Indicators o h ul Wars nt a o reflect the response given by the o Sh ng y S e ha Toro k v i n i o i S l z Hub Representative in relation T v ei S in ic h A t o l ip o g n Vall e to this category. e a ck ap n T T h o Sydney ol r e m e y 18
 A Tale of 44 Cities Page 17 Page 19