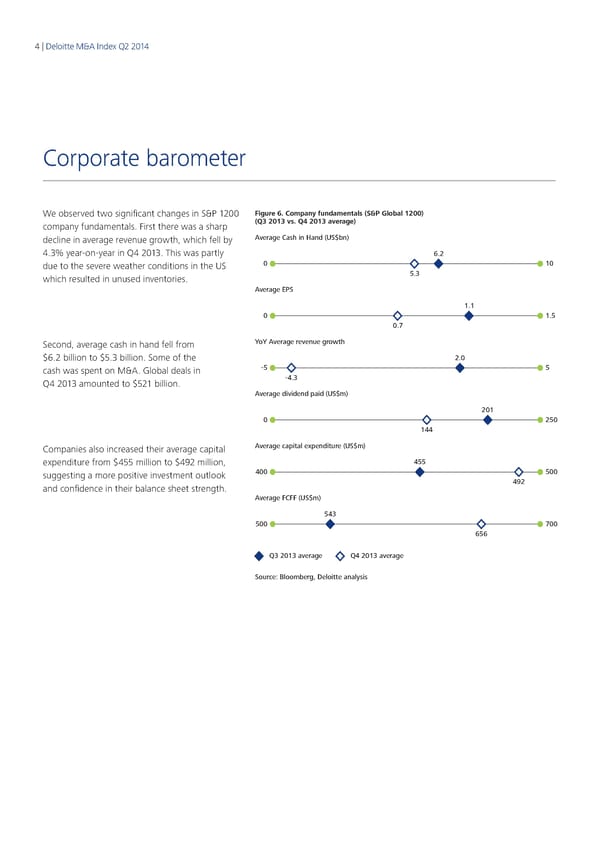
4 | Deloitte M&A Index Q2 2014 Corporate barometer We observed two significant changes in S&P 1200 Figure 6. Company fundamentals (S&P Global 1200) company fundamentals. First there was a sharp (Q3 2013 vs. Q4 2013 average) decline in average revenue growth, which fell by Average Cash in Hand (US$bn) 4.3% year‑on‑year in Q4 2013. This was partly 6.2 due to the severe weather conditions in the US 0 10 which resulted in unused inventories. 5.3 Average EPS 1.1 0 1.5 0.7 Second, average cash in hand fell from YoY Average revenue growth $6.2 billion to $5.3 billion. Some of the 2.0 cash was spent on M&A. Global deals in -5 5 Q4 2013 amounted to $521 billion. -4.3 Average dividend paid (US$m) 201 0 250 144 Companies also increased their average capital Average capital expenditure (US$m) expenditure from $455 million to $492 million, 455 suggesting a more positive investment outlook 400 500 and confidence in their balance sheet strength. 492 Average FCFF (US$m) 543 500 700 656 Q3 2013 average Q4 2013 average Source: Bloomberg, Deloitte analysis
 Q2 2014 The Deloitte M&A Index Page 3 Page 5