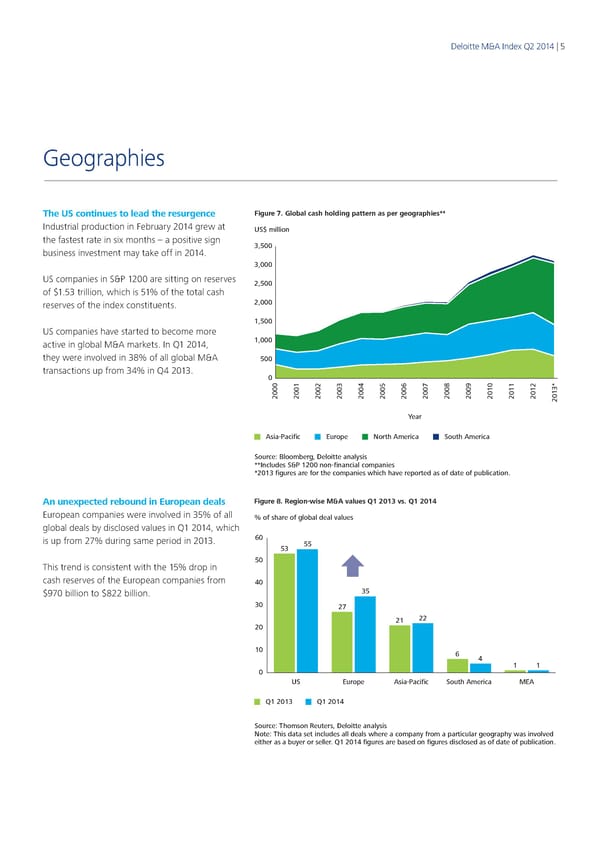
Deloitte M&A Index Q2 2014 | 5 Geographies The US continues to lead the resurgence Figure 7. Global cash holding pattern as per geographies** Industrial production in February 2014 grew at US$ million the fastest rate in six months – a positive sign 3,500 business investment may take off in 2014. 3,000 US companies in S&P 1200 are sitting on reserves 2,500 of $1.53 trillion, which is 51% of the total cash reserves of the index constituents. 2,000 1,500 US companies have started to become more active in global M&A markets. In Q1 2014, 1,000 they were involved in 38% of all global M&A 500 transactions up from 34% in Q4 2013. 0 2000 2001 2002 2003 2004 2005 2006 2007 2008 2009 2010 2011 2012 2013* Year Asia-Pacific Europe North America South America Source: Bloomberg, Deloitte analysis **Includes S&P 1200 non-financial companies *2013 figures are for the companies which have reported as of date of publication. An unexpected rebound in European deals Figure 8. Region-wise M&A values Q1 2013 vs. Q1 2014 European companies were involved in 35% of all re of global deal values % of sha global deals by disclosed values in Q1 2014, which is up from 27% during same period in 2013. 60 53 55 This trend is consistent with the 15% drop in 50 cash reserves of the European companies from 40 $970 billion to $822 billion. 35 30 27 21 22 20 10 6 4 11 0 US Europe Asia-Pacific South America MEA Q1 2013 Q1 2014 Source: Thomson Reuters, Deloitte analysis Note: This data set includes all deals where a company from a particular geography was involved either as a buyer or seller. Q1 2014 figures are based on figures disclosed as of date of publication.
 Q2 2014 The Deloitte M&A Index Page 4 Page 6