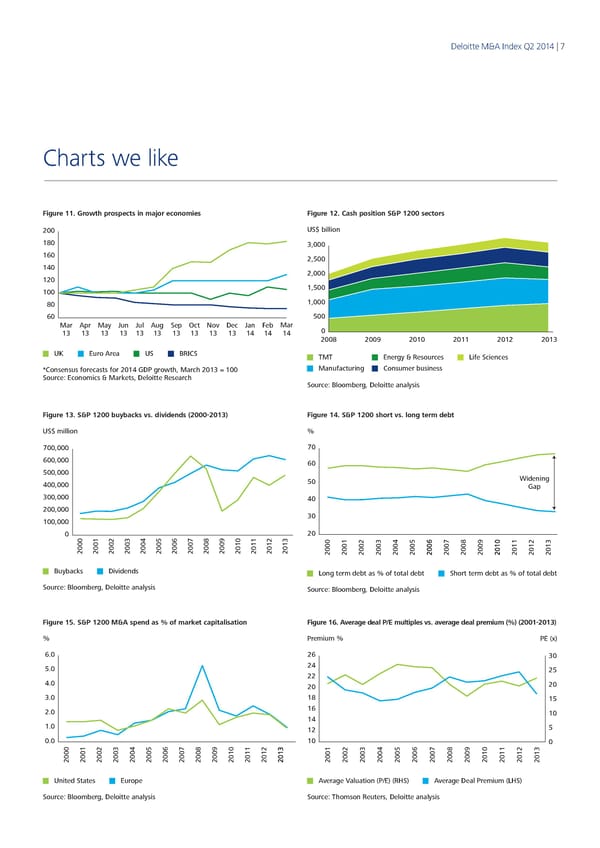
Deloitte M&A Index Q2 2014 | 7 Charts we like Figure 11. Growth prospects in major economies Figure 12. Cash position S&P 1200 sectors 200 US$ billion 180 3,000 160 2,500 140 2,000 120 100 1,500 80 1,000 60 500 Mar Apr May Jun Jul Aug Sep Oct Nov Dec Jan Feb Mar 0 13 13 13 13 13 13 13 13 13 13 14 14 14 2008 2009 2010 2011 2012 2013 UK Euro Area US BRICS TMT Energy & Resources Life Sciences *Consensus forecasts for 2014 GDP growth, March 2013 = 100 Manufacturing Consumer business Source: Economics & Markets, Deloitte Research Source: Bloomberg, Deloitte analysis Figure 13. S&P 1200 buybacks vs. dividends (2000-2013) Figure 14. S&P 1200 short vs. long term debt US$ million % 700,000 70 600,000 60 500,000 Widening 400,000 50 Gap 300,000 40 200,000 100,000 30 0 20 2000 2001 20022003 2004 20052006 20072008 2009 20102011 20122013 2000200020012001200220022003200320042004200520052006200620072007200820082009200920102010201120112012201220132013 Buybacks Dividends Long term debt as % of total debt Short term debt as % of total debt Source: Bloomberg, Deloitte analysis Source: Bloomberg, Deloitte analysis Figure 15. S&P 1200 M&A spend as % of market capitalisation Figure 16. Average deal P/E multiples vs. average deal premium (%) (2001-2013) % Premium % PE (x) 6.0 26 30 5.0 24 25 22 4.0 20 20 3.0 18 15 2.0 16 10 14 1.0 12 5 0.0 66 10 0 200020002001200120022002200320032004200420052005200200200720072008200820092009201020102011201120122012201320132001200220032004200520062007200820092010201120122013 United States Europe Average Valuation (P/E) (RHS) Average Deal Premium (LHS) Source: Bloomberg, Deloitte analysis Source: Thomson Reuters, Deloitte analysis
 Q2 2014 The Deloitte M&A Index Page 6 Page 8