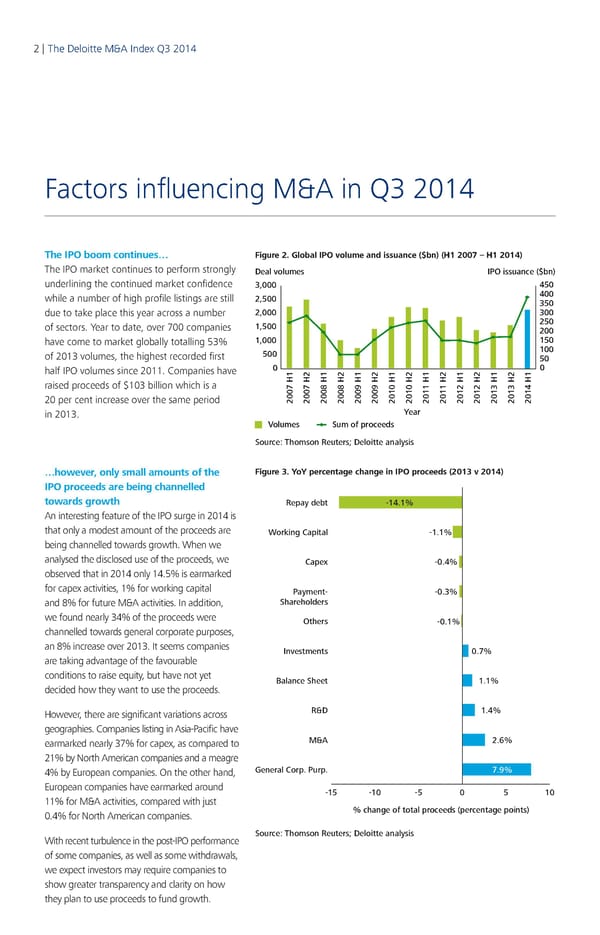
2 | The Deloitte M&A Index Q3 2014 Factors influencing M&A in Q3 2014 The IPO boom continues… Figure 2. Global IPO volume and issuance ($bn) (H1 2007 – H1 2014) The IPO market continues to perform strongly Deal volumes IPO issuance ($bn) underlining the continued market confidence 3,000 450 while a number of high profile listings are still 2,500 400 350 due to take place this year across a number 2,000 300 of sectors. Year to date, over 700 companies 1,500 250 200 have come to market globally totalling 53% 1,000 150 of 2013 volumes, the highest recorded first 500 100 50 half IPO volumes since 2011. Companies have 0 0 raised proceeds of $103 billion which is a 20 per cent increase over the same period 2007 H12007 H22008 H12008 H22009 H12009 H22010 H12010 H22011 H12011 H22012 H12012 H22013 H12013 H22014 H1 in 2013. Year Volumes Sum of proceeds Source: Thomson Reuters; Deloitte analysis …however, only small amounts of the Figure 3. YoY percentage change in IPO proceeds (2013 v 2014) IPO proceeds are being channelled towards growth Repay debt -14.1% An interesting feature of the IPO surge in 2014 is that only a modest amount of the proceeds are Working Capital -1.1% being channelled towards growth. When we analysed the disclosed use of the proceeds, we Capex -0.4% observed that in 2014 only 14.5% is earmarked for capex activities, 1% for working capital Payment- -0.3% and 8% for future M&A activities. In addition, Shareholders we found nearly 34% of the proceeds were Others -0.1% channelled towards general corporate purposes, an 8% increase over 2013. It seems companies Investments 0.7% are taking advantage of the favourable conditions to raise equity, but have not yet Balance Sheet 1.1% decided how they want to use the proceeds. However, there are significant variations across R&D 1.4% geographies. Companies listing in Asia‑Pacific have earmarked nearly 37% for capex, as compared to M&A 2.6% 21% by North American companies and a meagre 4% by European companies. On the other hand, General Corp. Purp. 7.9% European companies have earmarked around -15-10 -5 0510 11% for M&A activities, compared with just 0.4% for North American companies. % change of total proceeds (percentage points) With recent turbulence in the post‑IPO performance Source: Thomson Reuters; Deloitte analysis of some companies, as well as some withdrawals, we expect investors may require companies to show greater transparency and clarity on how they plan to use proceeds to fund growth.
 Q3 2014 The Deloitte M&A Index Page 1 Page 3