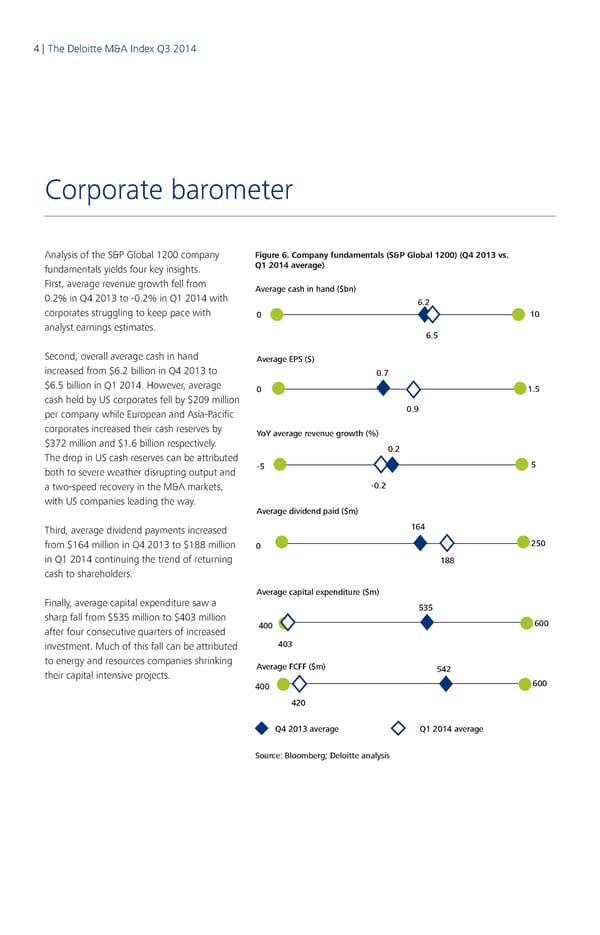
4 | The Deloitte M&A Index Q3 2014 5 | Corporate barometer Analysis of the S&P Global 1200 company Figure 6. Company fundamentals (S&P Global 1200) (Q4 2013 vs. fundamentals yields four key insights. Q1 2014 average) First, average revenue growth fell from Average cash in hand ($bn) 0.2% in Q4 2013 to ‑0.2% in Q1 2014 with 6.2 corporates struggling to keep pace with 0 10 analyst earnings estimates. 6.5 Second, overall average cash in hand Average EPS ($) increased from $6.2 billion in Q4 2013 to 0.7 $6.5 billion in Q1 2014. However, average 0 1.5 cash held by US corporates fell by $209 million per company while European and Asia‑Pacific 0.9 corporates increased their cash reserves by YoY average revenue growth (%) $372 million and $1.6 billion respectively. 0.2 The drop in US cash reserves can be attributed 5 both to severe weather disrupting output and -5 a two‑speed recovery in the M&A markets, -0.2 with US companies leading the way. Average dividend paid ($m) Third, average dividend payments increased 164 from $164 million in Q4 2013 to $188 million 0 250 in Q1 2014 continuing the trend of returning 188 cash to shareholders. Average capital expenditure ($m) Finally, average capital expenditure saw a 535 sharp fall from $535 million to $403 million 600 after four consecutive quarters of increased 400 investment. Much of this fall can be attributed 403 to energy and resources companies shrinking Average FCFF ($m) their capital intensive projects. 542 400 600 420 Q4 2013 average Q1 2014 average Source: Bloomberg; Deloitte analysis
 Q3 2014 The Deloitte M&A Index Page 3 Page 5