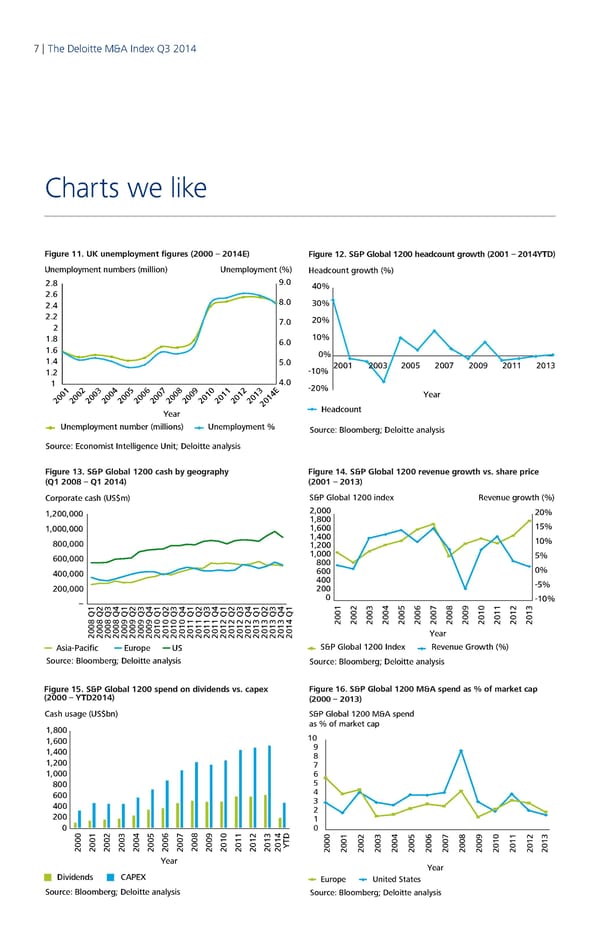
7 | The Deloitte M&A Index Q3 2014 Charts we like Figure 11. UK unemployment figures (2000 – 2014E) Figure 12. S&P Global 1200 headcount growth (2001 – 2014YTD) Unemployment numbers (million) Unemployment (%) Headcount growth (%) 2.8 9.0 40% 2.6 2.4 8.0 30% 2.2 7.0 20% 2 1.8 6.0 10% 1.6 0% 1.4 5.0 2001 2005 2007200920112 1.2 -10% 2003 013 1 4.0 -20% 2 4 0 1 E Year 01 2001 200 2003 200 2005 2006 2007 2008 2009 2 201 2012 2013 2014 Headcount Year Unemployment number (millions) Unemployment % Source: Bloomberg; Deloitte analysis Source: Economist Intelligence Unit; Deloitte analysis Figure 13. S&P Global 1200 cash by geography Figure 14. S&P Global 1200 revenue growth vs. share price (Q1 2008 – Q1 2014) (2001 – 2013) Corporate cash (US$m) S&P Global 1200 index Revenue growth (%) 1,200,000 2,000 20% 1,800 1,000,000 1,600 15% 1,400 10% 800,000 1,200 600,000 1,000 5% 800 400,000 600 0% 400 -5% 200,000 200 – 0 -10% 2001 2002 2003 2004 2005 2006 2007 2008 2009 2010 2011 2012 2013 2008 Q12008 Q22008 Q32008 Q42009 Q12009 Q22009 Q32009 Q42010 Q12010 Q22010 Q32010 Q42011 Q12011 Q22011 Q32011 Q42012 Q12012 Q22012 Q32012 Q42013 Q12013 Q22013 Q32013 Q42014 Q1Year Asia-Pacific Europe US S&P Global 1200 Index Revenue Growth (%) Source: Bloomberg; Deloitte analysis Source: Bloomberg; Deloitte analysis Figure 15. S&P Global 1200 spend on dividends vs. capex Figure 16. S&P Global 1200 M&A spend as % of market cap (2000 – YTD2014) (2000 – 2013) Cash usage (US$bn) S&P Global 1200 M&A spend 1,800 as % of market cap 1,600 10 1,400 9 1,200 8 7 1,000 6 800 5 600 4 400 3 200 2 1 0 0 2000 2001 2002 2003 2004 2005 2006 2007 2008 2009 2010 2011 2012 2013 2014 YTD 2000 2001 2002 2003 2004 2005 2006 2007 2008 2009 2010 2011 2012 2013 Year Year Dividends CAPEX Europe United States Source: Bloomberg; Deloitte analysis Source: Bloomberg; Deloitte analysis
 Q3 2014 The Deloitte M&A Index Page 6 Page 8