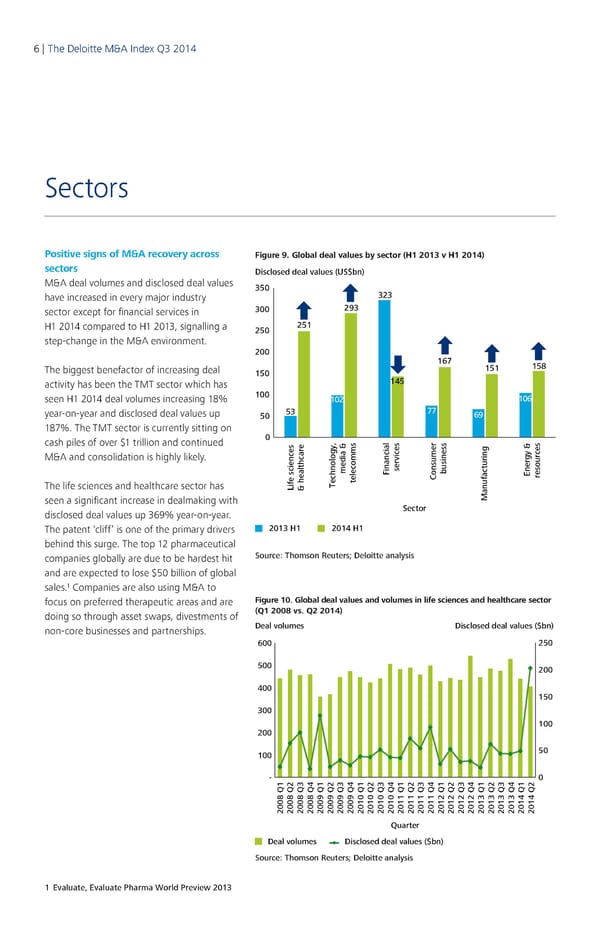
6 | The Deloitte M&A Index Q3 2014 7 | Sectors Positive signs of M&A recovery across Figure 9. Global deal values by sector (H1 2013 v H1 2014) sectors Disclosed deal values (US$bn) M&A deal volumes and disclosed deal values 350 have increased in every major industry 323 sector except for financial services in 300 293 H1 2014 compared to H1 2013, signalling a 250 251 step‑change in the M&A environment. 200 167 158 The biggest benefactor of increasing deal 150 151 activity has been the TMT sector which has 145 seen H1 2014 deal volumes increasing 18% 100 102 106 year‑on‑year and disclosed deal values up 50 53 77 69 187%. The TMT sector is currently sitting on cash piles of over $1 trillion and continued 0 & & M&A and consolidation is highly likely. media FinancialservicesConsumerbusiness Energy resources The life sciences and healthcare sector has Life sciences& healthcareTechnology,telecomms seen a significant increase in dealmaking with Manufacturing disclosed deal values up 369% year‑on‑year. Sector The patent ‘cliff’ is one of the primary drivers 2013 H1 2014 H1 behind this surge. The top 12 pharmaceutical companies globally are due to be hardest hit Source: Thomson Reuters; Deloitte analysis and are expected to lose $50 billion of global 1 sales. Companies are also using M&A to focus on preferred therapeutic areas and are Figure 10. Global deal values and volumes in life sciences and healthcare sector doing so through asset swaps, divestments of (Q1 2008 vs. Q2 2014) non‑core businesses and partnerships. Deal volumes Disclosed deal values ($bn) 600 250 500 200 400 150 300 0 10 200 100 50 - 0 2008 Q12008 Q22008 Q32008 Q42009 Q12009 Q22009 Q32009 Q42010 Q12010 Q22010 Q32010 Q42011 Q12011 Q22011 Q32011 Q42012 Q12012 Q22012 Q32012 Q42013 Q12013 Q22013 Q32013 Q42014 Q12014 Q2 Quarter Deal volumes Disclosed deal values ($bn) Source: Thomson Reuters; Deloitte analysis 1 Evaluate, Evaluate Pharma World Preview 2013
 Q3 2014 The Deloitte M&A Index Page 5 Page 7