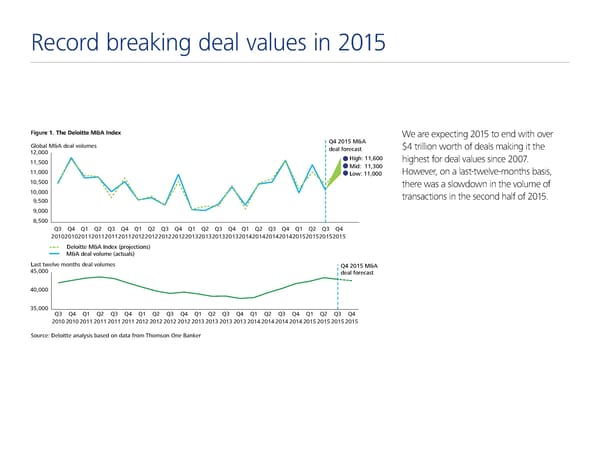
Record breaking deal values in 2015 Figure 1. The Deloitte M&A Index We are expecting 2015 to end with over lo al M&A deal volumes Q4 2015 M&A $4 trillion worth of deals making it the 12000 deal orecast 11500 Ši‹„€ 11Œ00 highest for deal values since 2007. Mid€ 1100 11000 ˆo‰€ 11000 However, on a last-twelve-months basis, 10500 there was a slowdown in the volume of 10000 transactions in the second half of 2015. 500 000 500 Q Q4 Q1 Q2 Q Q4 Q1 Q2 Q Q4 Q1 Q2 Q Q4 Q1 Q2 Q Q4 Q1 Q2 Q Q4 201020102011201120112011201220122012201220120120120120142014201420142015201520152015 Deloitte M&A Index (projections) M&A deal volume (actuals) ˆast t‰elve mont„s deal volumes Q4 2015 M&A 45000 deal orecast 40000 5000 Q Q4 Q1 Q2 Q Q4 Q1 Q2 Q Q4 Q1 Q2 Q Q4 Q1 Q2 Q Q4 Q1 Q2 Q Q4 20102010 2011 201120112011201220122012201220120120120120142014201420142015201520152015 ource€ Deloitte anal‚sis ased on data rom ƒ„omson …ne †an‡er
 Deloitte M&A Index | Presentation Page 1 Page 3