Deloitte M&A Index | Presentation
Opportunities amidst divergence
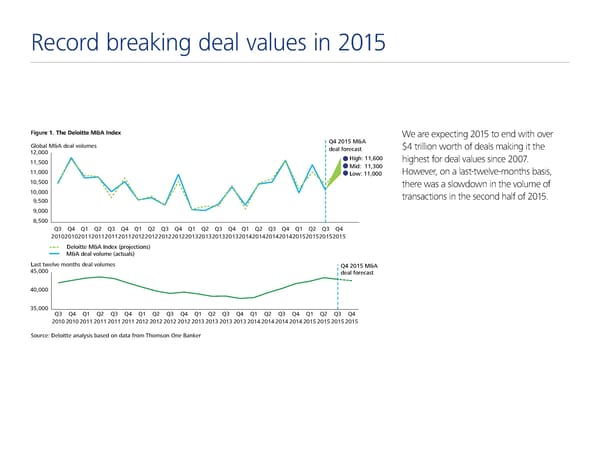
Record breaking deal values in 2015 Figure 1. The Deloitte M&A Index We are expecting 2015 to end with over lo al M&A deal volumes Q4 2015 M&A $4 trillion worth of deals making it the 12000 deal orecast 11500 Ši‹„€ 11Œ00 highest for deal values since 2007. Mid€ 1100 11000 ˆo‰€ 11000 However, on a last-twelve-months basis, 10500 there was a slowdown in the volume of 10000 transactions in the second half of 2015. 500 000 500 Q Q4 Q1 Q2 Q Q4 Q1 Q2 Q Q4 Q1 Q2 Q Q4 Q1 Q2 Q Q4 Q1 Q2 Q Q4 201020102011201120112011201220122012201220120120120120142014201420142015201520152015 Deloitte M&A Index (projections) M&A deal volume (actuals) ˆast t‰elve mont„s deal volumes Q4 2015 M&A 45000 deal orecast 40000 5000 Q Q4 Q1 Q2 Q Q4 Q1 Q2 Q Q4 Q1 Q2 Q Q4 Q1 Q2 Q Q4 Q1 Q2 Q Q4 20102010 2011 201120112011201220122012201220120120120120142014201420142015201520152015 ource€ Deloitte anal‚sis ased on data rom ƒ„omson …ne †an‡er
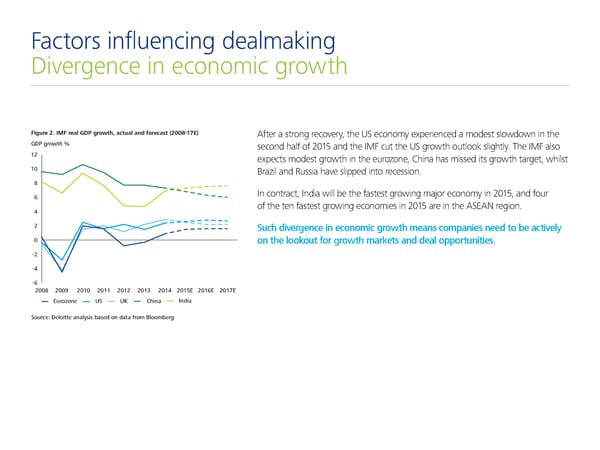
Factors influencing dealmaking Divergence in economic growth Figure 2. IMF real GDP growth, actual and forecast (2008-1 After a strong recovery, the US economy experienced a modest slowdown in the ‚Dƒ €ro„h … second half of 2015 and the IMF cut the US growth outlook slightly. The IMF also 12 expects modest growth in the eurozone, China has missed its growth target, whilst 10 Brazil and Russia have slipped into recession. 8 6 In contract, India will be the fastest growing major economy in 2015, and four 4 of the ten fastest growing economies in 2015 are in the ASEAN region. 2 Such divergence in economic growth means companies need to be actively 0 on the lookout for growth markets and deal opportunities. -2 -4 -6 2008 2009 2010 2011 2012 2013 2014 2015E 2016E 2017E Eurozone US UK China India Source: Deoie anai aed on daa ro oo er€
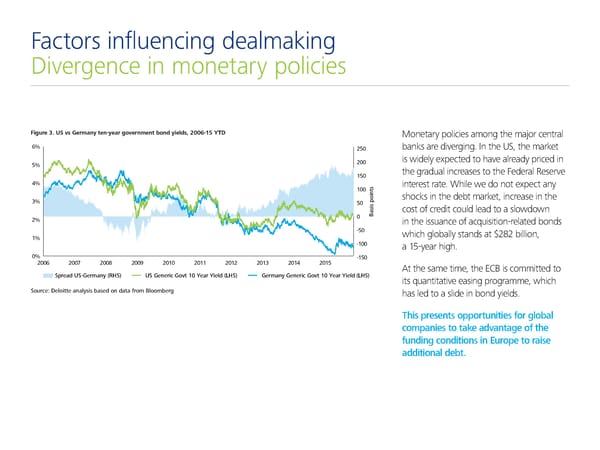
Factors influencing dealmaking Divergence in monetary policies Figure 3. US vs Germany ten-year government bond yields, 2006-15 Y Monetary policies among the major central ‚ 250 banks are diverging. In the US, the market 5 200 is widely expected to have already priced in 150 the gradual increases to the Federal Reserve € interest rate. While we do not expect any 100 shocks in the debt market, increase in the 50 cost of credit could lead to a slowdown 0 Basis points 2 in the issuance of acquisition-related bonds -50 which globally stands at $282 billion, 1 -100 a 15-year high. 0 -150 200‚ 200… 200„ 200ƒ 2010 2011 2012 201 201€ 2015 At the same time, the ECB is committed to Spread US-Germany (S US Generic Got 10 ear ield (S Germany Generic Got 10 ear ield (S its quantitative easing programme, which Source: Deloitte analysis based on data from Bloomberg has led to a slide in bond yields. This presents opportunities for global companies to take advantage of the funding conditions in Europe to raise additional debt.
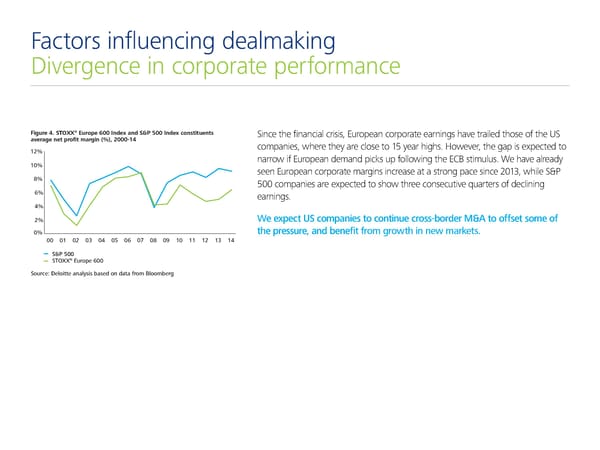
Factors influencing dealmaking Divergence in corporate performance ® Figure 4. STOXX Europe 600 Index and S&P 500 Index constituents Since the financial crisis, European corporate earnings have trailed those of the US average net profit argin 000€4 companies, where they are close to 15 year highs. However, the gap is expected to narrow if European demand picks up following the ECB stimulus. We have already 0 seen European corporate margins increase at a strong pace since 2013, while S&P 500 companies are expected to show three consecutive quarters of declining 6 earnings. We expect US companies to continue cross-border M&A to offset some of 0 the pressure, and benefit from growth in new markets. 00 0 0 0 0 05 06 0‚ 0 0€ 0 S&P 500 STOXX® Europe 600 Source: Deloitte analysis based on data from loomber
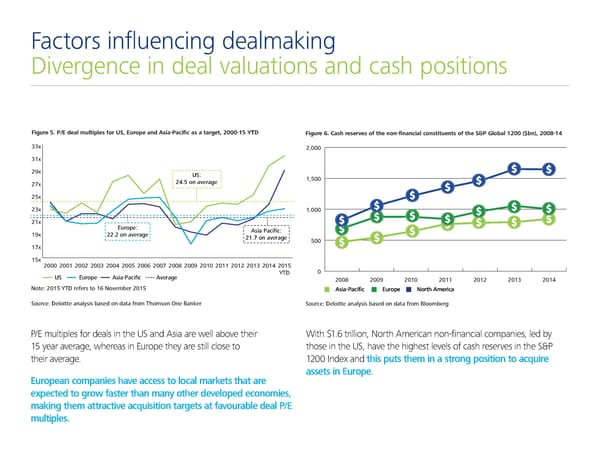
Factors influencing dealmaking Divergence in deal valuations and cash positions Figure 5. P/E deal multiples for US, Europe and Asia-Pacific as a target, 2000-5 Figure 6. Cash reserves of the non-financial constituents of the S&P Global 1200 (bn 200-1 ˆˆ† 000 ˆ1† 2‡† US: 25 o averae 00 2† 25† 2ˆ† 000 21† Europe: Asia Pacific: 1‡† 222 o averae 21 o averae 00 1† 15† 2000 2001 2002 200ˆ 200 2005 2006 200 200‰ 200‡ 2010 2011 2012 201ˆ 201 2015 YTD 0 US Europe Asia-Pacific Averae 00 00 00 0 0 0 0 Note: 2015 YTD refers to 16 November 2015 Asia-Pacific Europe North America Source: De oitte aa sis base€ o €ata from T‚omso ƒe „a…er Source: Deloitte analysis based on data from Bloomberg P/E multiples for deals in the US and Asia are well above their With $1.6 trillion, North American non-financial companies, led by 15 year average, whereas in Europe they are still close to those in the US, have the highest levels of cash reserves in the S&P their average. 1200 Index and this puts them in a strong position to acquire assets in Europe. European companies have access to local markets that are expected to grow faster than many other developed economies, making them attractive acquisition targets at favourable deal P/E multiples.
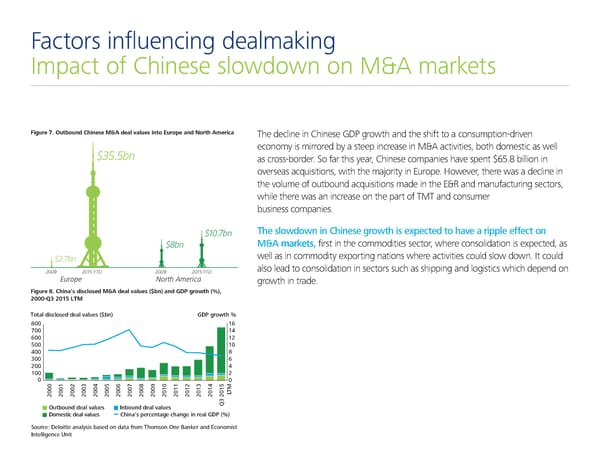
Factors influencing dealmaking Impact of Chinese slowdown on M&A markets Figure …. †ubound Chinese M&A deal values ino ‡uroˆe and ‰orh AŠerica The decline in Chinese GDP growth and the shift to a consumption-driven $35.5bn economy is mirrored by a steep increase in M&A activities, both domestic as well as cross-border. So far this year, Chinese companies have spent $65.8 billion in overseas acquisitions, with the majority in Europe. However, there was a decline in the volume of outbound acquisitions made in the E&R and manufacturing sectors, while there was an increase on the part of TMT and consumer business companies. $10.7bn The slowdown in Chinese growth is expected to have a ripple effect on $8bn M&A markets, first in the commodities sector, where consolidation is expected, as $2.7bn well as in commodity exporting nations where activities could slow down. It could 2009 2015 YTD 2009 2015 YTD also lead to consolidation in sectors such as shipping and logistics which depend on Europe North America growth in trade. Figure 8. China’s disclosed M&A deal values ($bn) and GDP growh () €‚ ƒ„M Total disclosed deal values ($bn) GDP growth % ‡ … † ƒ … € „ ƒ ‡ ‚ … € ƒ € Š € € € €€ ‚€ ƒ€ „€ …€ †€ ‡€ ‹ € € € €€ ‚€ ƒ ‰T utbound deal values nbound deal values ˆ‚ € „ Domestic deal values Œhina’s ‘ercentage change in real GDP (%) Source: Deloitte analysis based on data from Thomson ne aner and conomist ntelligence nit
Factors influencing dealmaking Strong resurgence in Japanese dealmaking Figure 9. Japan’s disclosed M&A deal values ($bn) Driven by the weak yen, Japanese corporate profits are at their highest levels in $81.4bn over ten years. At the same time, Japan remains saddled with falling domestic consumption compounded by a decline in real earnings, an aging population and a $56.4bn shrinking GDP. $46bn In response to these pressures, Japanese companies are actively looking abroad for growth prospects. $10.7bn 2009 2015 YTD 2009 2015 YTD Outbound Domestic Source: Deloitte analysis based on data from Thomson One Banker
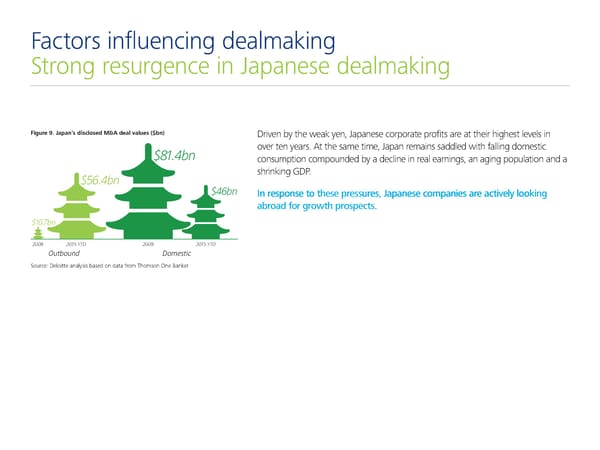
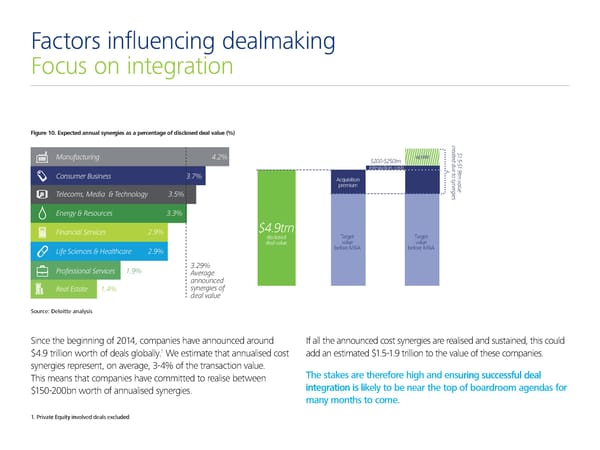
Figure 10. Expected annual synergies as a percentage of disclosed deal value (%) Figure 10. Expected annual synergies as a percentage of disclosed deal value (%) Manufacturing Manufacturing Consumer Business Consumer Business Telecoms, Media & Technology Telecoms, Media & Technology Factors influencing dealmaking Energy & Resources Energy & Resources inancial Services € inancial Services € Focus on integration Life Sciences & Healthcare € Life Sciences & Healthcare € Professional Services ƒ€ € Professional Services ƒ€ € ‚verage ‚verage announced announced Real Estate ƒ synergies of Real Estate ƒ synergies of Figure 10. Expected annual synergies as a percentage of disclosed deal value (%) deal value deal value c c r r e e a „ a „ t ƒ t ƒ e upside e Manufacturing upside d d d d† „……†„…‡n † „……†„…‡n „ „ u ƒ u ƒ integration costs e t integration costs e t€ € t t o sr o sr Consumer Business n v Acquisition y n v Acquisition y a n a n l e l premium e u premium r u r e g e g i i e Telecoms, Media & Technology e s s Energy & Resources „€trn € „€trn inancial Services Target Target disclosed Target Target disclosed deal value value value deal value value value before M&A before M&A before M&A before M&A Life Sciences & Healthcare € Professional Services ƒ€ € ‚verage announced Real Estate ƒ synergies of deal value c r Source: Deloitte analysis e Source: Deloitte analysis a „ t ƒ upside e d d „……†„…‡n † „ u ƒ integration costs e t € t o sr Acquisition y n v Since the beginning of 2014, companies have announced around If all the announced cost synergies are realised and sustained, this could n a e l premium r u 1 g e i $4.9 trillion worth of deals globally. We estimate that annualised cost add an estimated $1.5-1.9 trillion to the value of these companies. e s synergies represent, on average, 3-4% of the transaction value. This means that companies have committed to realise between The stakes are therefore high and ensuring successful deal $150-200bn worth of annualised synergies. integration is likely to be near the top of boardroom agendas for „€trn disclosed Target Target many months to come. deal value value value before M&A before M&A 1. Private Equity involved deals excluded Source: Deloitte analysis
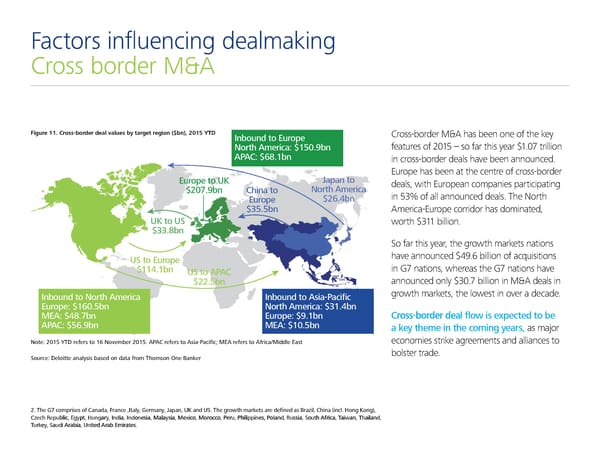
Factors influencing dealmaking Cross border M&A Figure 11. Cross-border deal values by target region ($bn), 2015 YTD ’ bo to ro…e Cross-border M&A has been one of the key Nort€ America: ˆ150.Šb features of 2015 – so far this year $1.07 trillion APAC: ˆ6Œ.1b in cross-border deals have been announced. Europe has been at the centre of cross-border ro…e to †‡ ‘a…a to deals, with European companies participating ˆ20‰.Šb C€i a to Nort€ America in 53% of all announced deals. The North ro…e ˆ26.Žb ˆ‹5.5b America-Europe corridor has dominated, †‡ to † worth $311 billion. ˆ‹‹.Œb So far this year, the growth markets nations † to ro…e have announced $49.6 billion of acquisitions ˆ11Ž.1b † to APAC in G7 nations, whereas the G7 nations have ˆ22.5b announced only $30.7 billion in M&A deals in ’ bo to Nort€ America ’ bo to Asia-Pacific growth markets, the lowest in over a decade. ro…e: ˆ160.5b Nort€ America: ˆ‹1.Žb MA: ˆŽŒ.‰b ro…e: ˆŠ.1b Cross-border deal flow is expected to be APAC: ˆ56.Šb MA: ˆ10.5b a key theme in the coming years, as major Note: 2015 YTD refers to 16 November 2015. APAC refers to Asia-Pacific; MA refers to AfricaMie ast economies strike agreements and alliances to orce: Deoitte a asis base o ata from T€omso ‚ e ƒa „er bolster trade. 2. The G7 comprises of Canada, France ,Italy, Germany, Japan, UK and US. The growth markets are defined as Brazil, China (incl. Hong Kong), Czech Republic, Egypt, Hungary, India, Indonesia, Malaysia, Mexico, Morocco, Peru, Philippines, Poland, Russia, South Africa, Taiwan, Thailand, Turkey, Saudi Arabia, United Arab Emirates.
About The Deloitte M&A Index Contacts The Deloitte M&A Index is a forward-looking indicator that forecasts future global M&A deal volumes and identifies the factors influencing conditions for Iain Macmillan dealmaking. Managing Partner, Global M&A Services The Deloitte M&A Index is created from a composite of weighted market 020 7007 2975 indicators from four major data sets: macroeconomic and key market imacmillan@deloitte.co.uk indicators, funding and liquidity conditions, company fundamentals, valuations. Sriram Prakash Each quarter, these variables are tested for their statistical significance and Global Lead M&A Insight relative relationships to M&A volumes. As a result, we have a dynamic and 020 7303 3155 evolving model which allows Deloitte to identify the factors impacting sprakash@deloitte.co.uk dealmaking and enable us to project future M&A deal volumes. The Deloitte M&A Index has an accuracy rate of over 90% dating back to Q1 2008. In this publication, references to Deloitte are references to Deloitte LLP, the UK member firm of DTTL. Deloitte refers to one or more of Deloitte Touche Tohmatsu Limited (“DTTL”), a UK private company limited by guarantee, and its network of member firms, each of which is a legally separate and independent entity. Please see www.deloitte.co.uk/about for a detailed description of the legal structure of DTTL and its member firms. Deloitte LLP is the United Kingdom member firm of DTTL. This publication has been written in general terms and therefore cannot be relied on to cover specific situations; application of the principles set out will depend upon the particular circumstances involved and we recommend that you obtain professional advice before acting or refraining from acting on any of the contents of this publication. Deloitte LLP would be pleased to advise readers on how to apply the principles set out in this publication to their specific circumstances. Deloitte LLP accepts no duty of care or liability for any loss occasioned to any person acting or refraining from action as a result of any material in this publication. © 2015 Deloitte LLP. All rights reserved. Deloitte LLP is a limited liability partnership registered in England and Wales with registered number OC303675 and its registered office at 2 New Street Square, London EC4A 3BZ, United Kingdom. Tel: +44 (0) 20 7936 3000 Fax: +44 (0) 20 7583 1198. Designed and produced by The Creative Studio at Deloitte, London. J3241