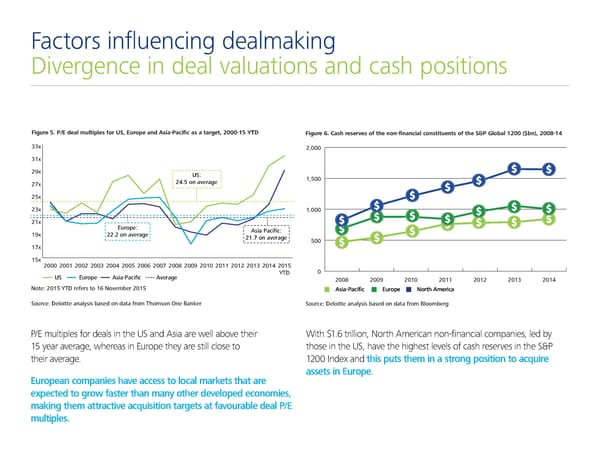
Factors influencing dealmaking Divergence in deal valuations and cash positions Figure 5. P/E deal multiples for US, Europe and Asia-Pacific as a target, 2000-5 Figure 6. Cash reserves of the non-financial constituents of the S&P Global 1200 (bn 200-1 ˆˆ† 000 ˆ1† 2‡† US: 25 o averae 00 2† 25† 2ˆ† 000 21† Europe: Asia Pacific: 1‡† 222 o averae 21 o averae 00 1† 15† 2000 2001 2002 200ˆ 200 2005 2006 200 200‰ 200‡ 2010 2011 2012 201ˆ 201 2015 YTD 0 US Europe Asia-Pacific Averae 00 00 00 0 0 0 0 Note: 2015 YTD refers to 16 November 2015 Asia-Pacific Europe North America Source: De oitte aa sis base€ o €ata from T‚omso ƒe „a…er Source: Deloitte analysis based on data from Bloomberg P/E multiples for deals in the US and Asia are well above their With $1.6 trillion, North American non-financial companies, led by 15 year average, whereas in Europe they are still close to those in the US, have the highest levels of cash reserves in the S&P their average. 1200 Index and this puts them in a strong position to acquire assets in Europe. European companies have access to local markets that are expected to grow faster than many other developed economies, making them attractive acquisition targets at favourable deal P/E multiples.
 Deloitte M&A Index | Presentation Page 5 Page 7