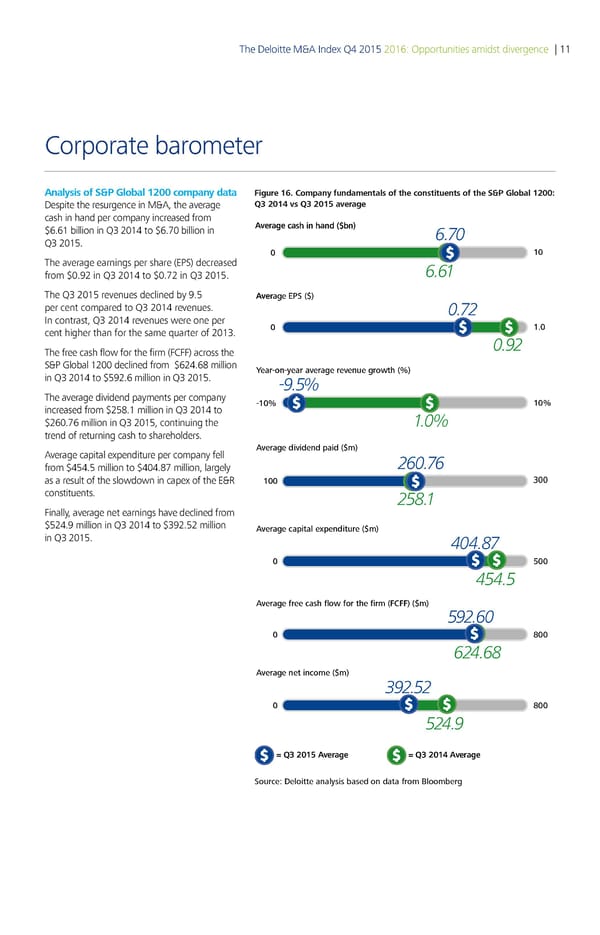
The Deloitte M&A Index Q4 2015 2016: Opportunities amidst divergence | 11 Corporate barometer Analysis of S&P Global 1200 company data Figure 16. Company fundamentals of the constituents of the S&P Global 1200 Despite the resurgence in M&A, the average 201 s 201 aerage cash in hand per company increased from $6.61 billion in Q3 2014 to $6.70 billion in Average cas in and bn 6.70 Q3 2015. 0 10 The average earnings per share (EPS) decreased 6.61 from $0.92 in Q3 2014 to $0.72 in Q3 2015. The Q3 2015 revenues declined by 9.5 Average S per cent compared to Q3 2014 revenues. 0.72 In contrast, Q3 2014 revenues were one per 0 1Š0 cent higher than for the same quarter of 2013. 0.92 The free cash flow for the firm (FCFF) across the S&P Global 1200 declined from $624.68 million ear€on€year average revenue gro‚t ƒ in Q3 2014 to $592.6 million in Q3 2015. -9.5% The average dividend payments per company €10ƒ 10ƒ increased from $258.1 million in Q3 2014 to $260.76 million in Q3 2015, continuing the 1.0% trend of returning cash to shareholders. Average capital expenditure per company fell Average dividend „aid m from $454.5 million to $404.87 million, largely 260.76 as a result of the slowdown in capex of the E&R 100 300 constituents. 258.1 Finally, average net earnings have declined from $524.9 million in Q3 2014 to $392.52 million Average ca„ital e…„enditure m in Q3 2015. 404.87 0 500 454.5 Average free cas flo‚ for te firm ˆ‰ˆˆ m 592.60 0 ‹00 624.68 Average net income m 392.52 0 ‹00 524.9 = Q3 2015 Average = Q3 201 Average Source: Deloitte analysis based on data from Bloomberg
 Deloitte M&A Index | Report Page 12 Page 14