Deloitte M&A Index | Report
Opportunities amidst divergence
2 | The Deloitte M&A Index Q4 2015 2016: Opportunities amidst divergence Contents Key points 3 Contacts Factors influencing M&A in 2016 4 Iain Macmillan Corporate barometer 11 Managing Partner, Deal corridors 12 Global M&A Services 020 7007 2975 Geographies 13 imacmillan@deloitte.co.uk Sectors 16 Sriram Prakash Global Lead M&A Insight Charts we like 22 020 7303 3155 sprakash@deloitte.co.uk Authors and contributors Sriram Prakash and Irina About The Deloitte M&A Index Bolotnikova are the UK The Deloitte M&A Index is a forward-looking indicator that forecasts future Insight team for M&A, global M&A deal volumes and identifies the factors influencing conditions for based in London. Haranath dealmaking. Sriyapureddy and Sukeerth Thodimaladinna are research The Deloitte M&A Index is created from a composite of weighted market analysts in the UK Research indicators from four major data sets: macroeconomic and key market Center, in India. indicators, funding and liquidity conditions, company fundamentals, valuations. The team would like to Each quarter, these variables are tested for their statistical significance and thank Ben Davies, James relative relationships to M&A volumes. As a result, we have a dynamic and Anson-Smith, Jo Brealey, evolving model which allows Deloitte to identify the factors impacting Kristie Ampuero and the dealmaking and enable us to project future M&A deal volumes. The Deloitte Deloitte Creative Studio for M&A Index has an accuracy rate of over 90% dating back to Q1 2008. their contribution in the production of the Deloitte In this publication, references to Deloitte are references to Deloitte LLP, the UK M&A Index. member firm of DTTL.
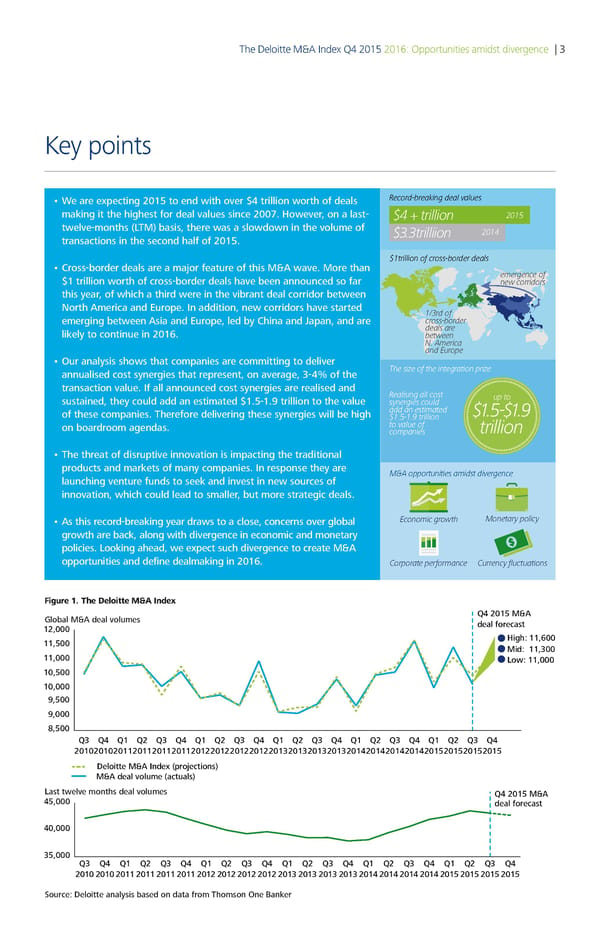
The Deloitte M&A Index Q4 2015 2016: Opportunities amidst divergence | 3 Key points • We are expecting 2015 to end with over $4 trillion worth of deals Record-breaing deal alues making it the highest for deal values since 2007. However, on a last- $ trillion 15 twelve-months (LTM) basis, there was a slowdown in the volume of $3.3trilliion 1 transactions in the second half of 2015. $1trillion of cross-border deals • Cross-border deals are a major feature of this M&A wave. More than emergence of $1 trillion worth of cross-border deals have been announced so far new corridors this year, of which a third were in the vibrant deal corridor between North America and Europe. In addition, new corridors have started 1/3rd of emerging between Asia and Europe, led by China and Japan, and are cross-border likely to continue in 2016. deals are between N. America and Europe • Our analysis shows that companies are committing to deliver €e si‚e of te integration pri‚e annualised cost synergies that represent, on average, 3-4% of the transaction value. If all announced cost synergies are realised and Realising all cost sustained, they could add an estimated $1.5-1.9 trillion to the value synergies could up to of these companies. Therefore delivering these synergies will be high add an estimated $1.5-$1. $1.5-1. trillion on boardroom agendas. to alue of trillion companies • The threat of disruptive innovation is impacting the traditional products and markets of many companies. In response they are ƒ„A opportunities amidst diergence launching venture funds to seek and invest in new sources of innovation, which could lead to smaller, but more strategic deals. • As this record-breaking year draws to a close, concerns over global Economic growt ƒonetary policy growth are back, along with divergence in economic and monetary policies. Looking ahead, we expect such divergence to create M&A opportunities and define dealmaking in 2016. …orporate performance …urrency fluctuations Figure 1. The Deloitte M&A Index lo al M&A deal volumes Q4 2015 M&A 12000 deal orecast 11500 Ši‹„€ 11Œ00 Mid€ 1100 11000 ˆo‰€ 11000 10500 10000 500 000 500 Q Q4 Q1 Q2 Q Q4 Q1 Q2 Q Q4 Q1 Q2 Q Q4 Q1 Q2 Q Q4 Q1 Q2 Q Q4 201020102011201120112011201220122012201220120120120120142014201420142015201520152015 Deloitte M&A Index (projections) M&A deal volume (actuals) ˆast t‰elve mont„s deal volumes Q4 2015 M&A 45000 deal orecast 40000 5000 Q Q4 Q1 Q2 Q Q4 Q1 Q2 Q Q4 Q1 Q2 Q Q4 Q1 Q2 Q Q4 Q1 Q2 Q Q4 20102010 2011 201120112011201220122012201220120120120120142014201420142015201520152015 ource€ Deloitte anal‚sis ased on data rom ƒ„omson …ne †an‡er
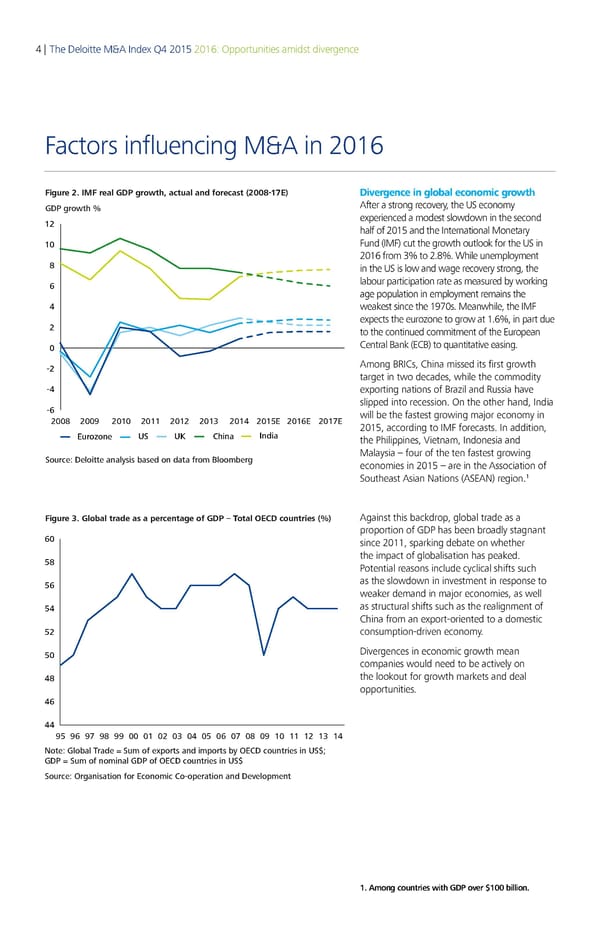
4 | The Deloitte M&A Index Q4 2015 2016: Opportunities amidst divergence Factors influencing M&A in 2016 Figure 2. IMF real GDP growth, actual and forecast (2008-1 Divergence in global economic growth ‚Dƒ €ro„h … After a strong recovery, the US economy 12 experienced a modest slowdown in the second half of 2015 and the International Monetary 10 Fund (IMF) cut the growth outlook for the US in 2016 from 3% to 2.8%. While unemployment 8 in the US is low and wage recovery strong, the 6 labour participation rate as measured by working age population in employment remains the 4 weakest since the 1970s. Meanwhile, the IMF expects the eurozone to grow at 1.6%, in part due 2 to the continued commitment of the European 0 Central Bank (ECB) to quantitative easing. -2 Among BRICs, China missed its first growth target in two decades, while the commodity -4 exporting nations of Brazil and Russia have slipped into recession. On the other hand, India -6 will be the fastest growing major economy in 2008 2009 2010 2011 2012 2013 2014 2015E 2016E 2017E 2015, according to IMF forecasts. In addition, Eurozone US UK China India the Philippines, Vietnam, Indonesia and Source: Deoie anai aed on daa ro oo er€ Malaysia – four of the ten fastest growing economies in 2015 – are in the Association of 1 Southeast Asian Nations (ASEAN) region. Figure 3. Global trade as a percentage of GDP – Total OECD countries (%) Against this backdrop, global trade as a proportion of GDP has been broadly stagnant 60 since 2011, sparking debate on whether 58 the impact of globalisation has peaked. Potential reasons include cyclical shifts such 56 as the slowdown in investment in response to weaker demand in major economies, as well 54 as structural shifts such as the realignment of China from an export-oriented to a domestic 52 consumption-driven economy. 50 Divergences in economic growth mean companies would need to be actively on 48 the lookout for growth markets and deal opportunities. 46 44 95 96 97 98 99 00 01 02 03 04 05 06 07 08 09 10 11 12 13 14 ote: o a rae € Sum of e‚ports an imports ƒ OEC countries in „S…† ‡ € Sum of nomina ‡ of OEC countries in „S… Source: Organisation for Economic Co-operation an eeopment 1. Among countries with GDP over $100 billion.
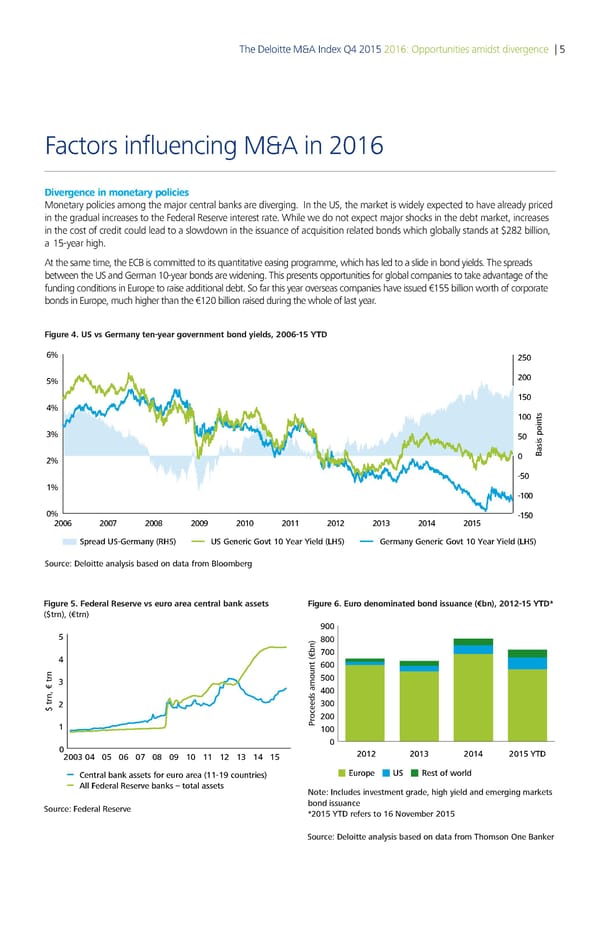
The Deloitte M&A Index Q4 2015 2016: Opportunities amidst divergence | 5 Factors influencing M&A in 2016 Divergence in monetary policies Monetary policies among the major central banks are diverging. In the US, the market is widely expected to have already priced in the gradual increases to the Federal Reserve interest rate. While we do not expect major shocks in the debt market, increases in the cost of credit could lead to a slowdown in the issuance of acquisition related bonds which globally stands at $282 billion, a 15-year high. At the same time, the ECB is committed to its quantitative easing programme, which has led to a slide in bond yields. The spreads between the US and German 10-year bonds are widening. This presents opportunities for global companies to take advantage of the funding conditions in Europe to raise additional debt. So far this year overseas companies have issued €155 billion worth of corporate bonds in Europe, much higher than the €120 billion raised during the whole of last year. Figure 4. US vs Germany ten-year government bond yields, 2006-15 Y ‚ 250 5 200 150 € 100 50 0 Basis points 2 -50 1 -100 0 -150 200‚ 200… 200„ 200ƒ 2010 2011 2012 201 201€ 2015 Spread US-Germany (S US Generic Got 10 ear ield (S Germany Generic Got 10 ear ield (S Source: Deloitte analysis based on data from Bloomberg Figure 5. Federal Reserve vs euro area central bank assets Figure 6. Euro denominated bond issuance (€bn), 2012-15 YTD ($trn), (€trn) 00 00 00 00 500 400 $ trn, € trn 300 oceeds amount …€bn‡200 1 „r 100 0 2012 2013 2014 2015 TD € 9 1 11 1 1 1 1 Central bank assets for euro area (11-19 countries) ‹uroŒe ŠS ˆest of ‰orld All Federal Reserve banks – total assets ote: ncludes inestment €rade‚ hi€h yield and emer€in€ markets Source Federal Reserve bond issuance ƒ2015 TD refers to 1 oember 2015 Source: Deloitte analysis based on data from Thomson One Banker
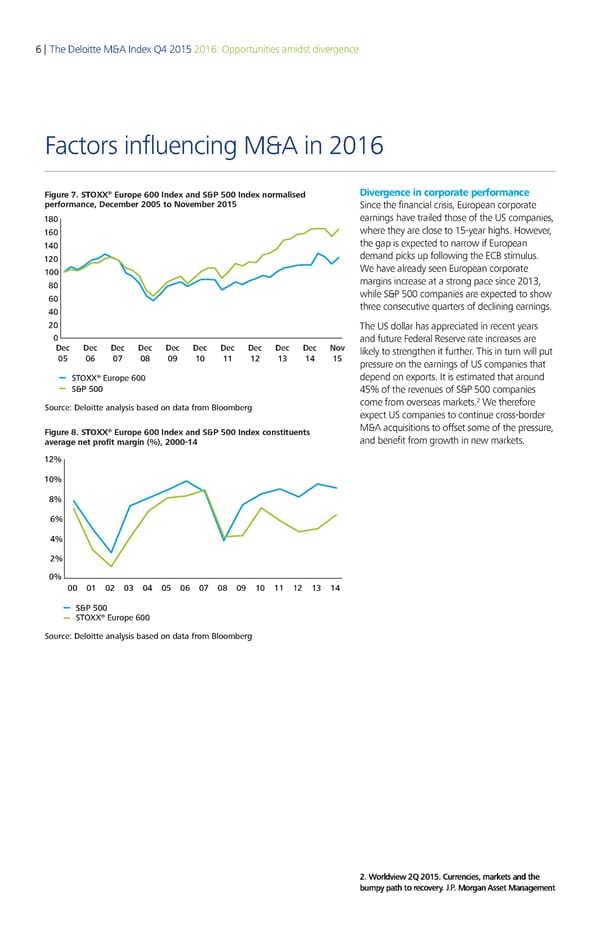
6 | The Deloitte M&A Index Q4 2015 2016: Opportunities amidst divergence Factors influencing M&A in 2016 ® Divergence in corporate performance Figure 7. STOXX Europe 600 Index and S&P 500 Index normalised performane eemer 005 o oemer 0€5 Since the financial crisis, European corporate 0 earnings have trailed those of the US companies, 60 where they are close to 15-year highs. However, 0 the gap is expected to narrow if European 0 demand picks up following the ECB stimulus. 00 We have already seen European corporate 0 margins increase at a strong pace since 2013, 60 while S&P 500 companies are expected to show 0 three consecutive quarters of declining earnings. 0 The US dollar has appreciated in recent years 0 and future Federal Reserve rate increases are Dec Dec Dec Dec Dec Dec Dec Dec Dec Dec o likely to strengthen it further. This in turn will put 05 06 0ƒ 0 0‚ 0 € 5 pressure on the earnings of US companies that STOXX® Europe 600 depend on exports. It is estimated that around S&P 500 45% of the revenues of S&P 500 companies 2 Source: Deloitte analysis based on data from loomber come from overseas markets. We therefore expect US companies to continue cross-border ® M&A acquisitions to offset some of the pressure, Figure 8. STOXX Europe 600 Index and S&P 500 Index constituents and benefit from growth in new markets. average net profit argin 000€‚ 0 6 0 00 0 0 0 0 05 06 0‚ 0 0€ 0 S&P 500 STOXX® Europe 600 Source: Deloitte analysis based on data from loomber 2. Worldview 2Q 2015. Currencies, markets and the bumpy path to recovery. J.P. Morgan Asset Management
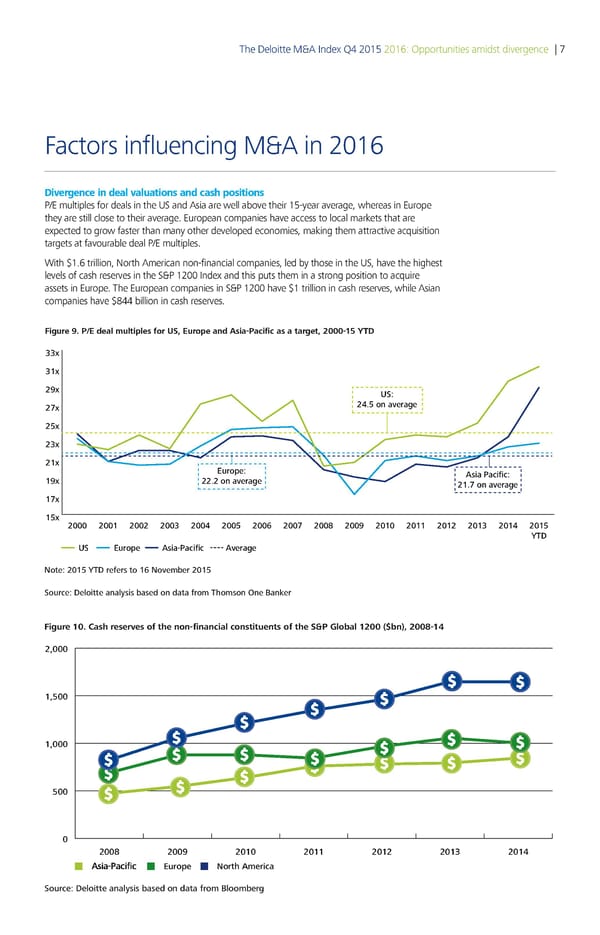
The Deloitte M&A Index Q4 2015 2016: Opportunities amidst divergence | 7 Factors influencing M&A in 2016 Divergence in deal valuations and cash positions P/E multiples for deals in the US and Asia are well above their 15-year average, whereas in Europe they are still close to their average. European companies have access to local markets that are expected to grow faster than many other developed economies, making them attractive acquisition targets at favourable deal P/E multiples. With $1.6 trillion, North American non-financial companies, led by those in the US, have the highest levels of cash reserves in the S&P 1200 Index and this puts them in a strong position to acquire assets in Europe. The European companies in S&P 1200 have $1 trillion in cash reserves, while Asian companies have $844 billion in cash reserves. Figure 9. P/E deal multiples for US, Europe and Asia-Pacific as a target, 2000- ˆˆ† ˆ1† 2‡† US: 2† 25 o averae 25† 2ˆ† 21† Europe: Asia Pacific: 1‡† 222 o averae 21 o averae 1† 15† 2000 2001 2002 200ˆ 200 2005 2006 200 200‰ 200‡ 2010 2011 2012 201ˆ 201 2015 YTD US Europe Asia-Pacific Averae Note: 2015 YTD refers to 16 November 2015 Source: De oitte aa sis base€ o €ata from T‚omso ƒe „a…er Figure 10. Cash reserves of the non-financial constituents of the S&P Global 1200 ($bn 200-1 000 00 000 00 0 00 00 00 0 0 0 0 Asia-Pacific Europe North America Source: Deloitte analysis based on data from Bloomberg
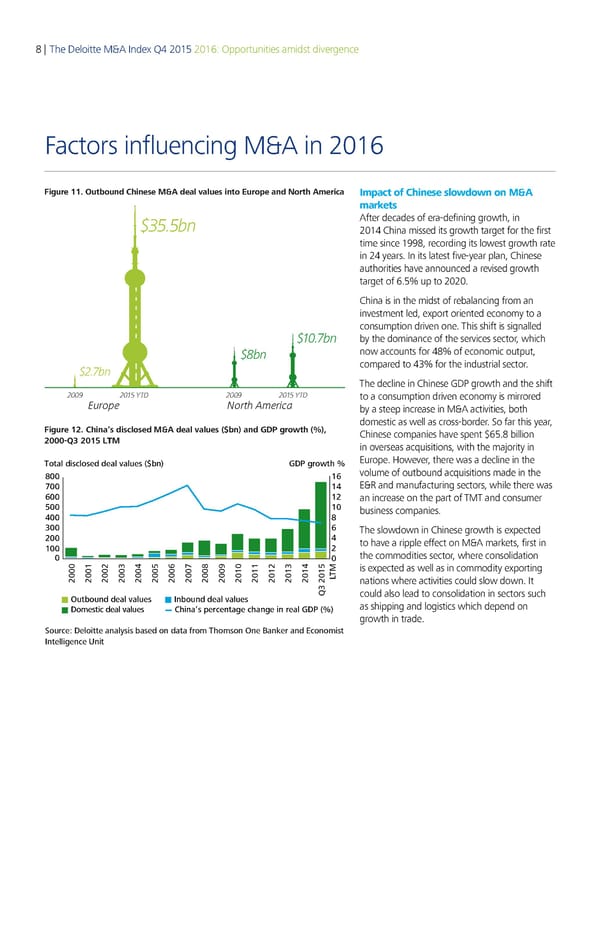
8 | The Deloitte M&A Index Q4 2015 2016: Opportunities amidst divergence Factors influencing M&A in 2016 Figure 11. „ubound Chinese M&A deal values ino …uro†e and ‡orh Aˆerica Impact of Chinese slowdown on M&A markets $35.5bn After decades of era-defining growth, in 2014 China missed its growth target for the first time since 1998, recording its lowest growth rate in 24 years. In its latest five-year plan, Chinese authorities have announced a revised growth target of 6.5% up to 2020. China is in the midst of rebalancing from an investment led, export oriented economy to a consumption driven one. This shift is signalled $10.7bn by the dominance of the services sector, which $8bn now accounts for 48% of economic output, $2.7bn compared to 43% for the industrial sector. The decline in Chinese GDP growth and the shift 2009 2015 YTD 2009 2015 YTD to a consumption driven economy is mirrored Europe North America by a steep increase in M&A activities, both domestic as well as cross-border. So far this year, Figure 12. China’s disclosed M&A deal values ($bn) and GDP groh () Chinese companies have spent $65.8 billion 2 21€ ‚ƒM in overseas acquisitions, with the majority in Total disclosed deal values ($bn) GDP growth % Europe. However, there was a decline in the ‡ … volume of outbound acquisitions made in the † ƒ E&R and manufacturing sectors, while there was … € an increase on the part of TMT and consumer „ business companies. ƒ ‡ ‚ … The slowdown in Chinese growth is expected € ƒ to have a ripple effect on M&A markets, first in € the commodities sector, where consolidation Š is expected as well as in commodity exporting € € € €€ ‚€ ƒ€ „€ …€ †€ ‡ € ‹€ € € €€ ‚€ ƒ ‰T nations where activities could slow down. It utbound deal values nbound deal values ˆ‚ € „ could also lead to consolidation in sectors such Domestic deal values Œhina’s ‘ercentage change in real GDP (%) as shipping and logistics which depend on growth in trade. Source: Deloitte analysis based on data from Thomson ne aner and conomist ntelligence nit
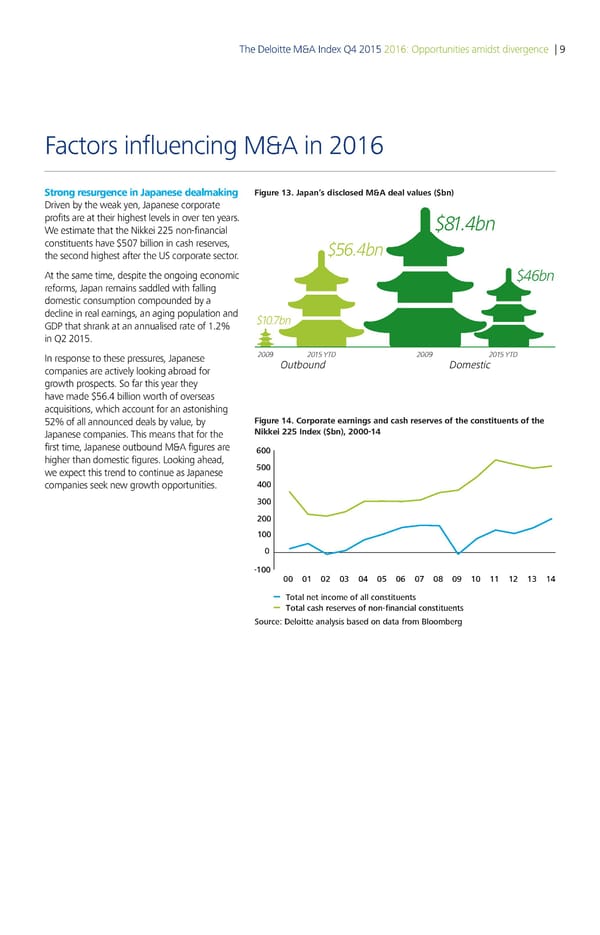
The Deloitte M&A Index Q4 2015 2016: Opportunities amidst divergence | 9 Factors influencing M&A in 2016 Strong resurgence in Japanese dealmaking Figure 13. Japan’s disclosed M&A deal values ($bn) Driven by the weak yen, Japanese corporate profits are at their highest levels in over ten years. $81.4bn We estimate that the Nikkei 225 non-financial constituents have $507 billion in cash reserves, $56.4bn the second highest after the US corporate sector. At the same time, despite the ongoing economic $46bn reforms, Japan remains saddled with falling domestic consumption compounded by a decline in real earnings, an aging population and $10.7bn GDP that shrank at an annualised rate of 1.2% in Q2 2015. In response to these pressures, Japanese 2009 2015 YTD 2009 2015 YTD companies are actively looking abroad for Outbound Domestic growth prospects. So far this year they have made $56.4 billion worth of overseas acquisitions, which account for an astonishing 52% of all announced deals by value, by Figure 14. Corporate earnings and cash reserves of the constituents of the Japanese companies. This means that for the Nikkei 225 Index ($bn 214 first time, Japanese outbound M&A figures are 00 higher than domestic figures. Looking ahead, 00 we expect this trend to continue as Japanese companies seek new growth opportunities. 00 300 200 100 0 -100 00 01 02 03 0 0 0 0 0 0 10 11 12 13 1 Total net income of all constituents Total cash reserves of non-financial constituents Source: Deloitte analysis based on data from Bloomberg
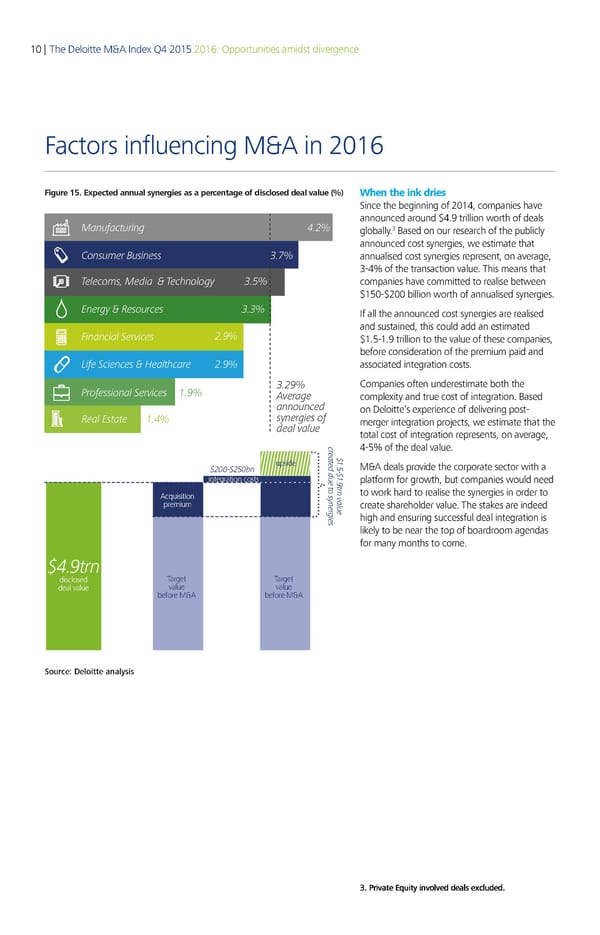
10 | The Deloitte M&A Index Q4 2015 2016: Opportunities amidst divergence Factors influencing M&A in 2016 Figure 15. Expected annual synergies as a percentage of disclosed deal value (%) When the ink dries Since the beginning of 2014, companies have announced around $4.9 trillion worth of deals Manufacturing 3 globally. Based on our research of the publicly announced cost synergies, we estimate that Consumer Business annualised cost synergies represent, on average, 3-4% of the transaction value. This means that Telecoms, Media & Technology companies have committed to realise between $150-$200 billion worth of annualised synergies. Energy & Resources If all the announced cost synergies are realised and sustained, this could add an estimated inancial Services € $1.5-1.9 trillion to the value of these companies, before consideration of the premium paid and Life Sciences & Healthcare € associated integration costs. Professional Services ƒ€ € Companies often underestimate both the ‚verage complexity and true cost of integration. Based announced on Deloitte’s experience of delivering post- Real Estate ƒ synergies of merger integration projects, we estimate that the deal value total cost of integration represents, on average, c r 4-5% of the deal value. e a „ t ƒ upside e d d M&A deals provide the corporate sector with a „……†„…‡n † „ u ƒ integration costs e t € platform for growth, but companies would need t o sr Acquisition y n v to work hard to realise the synergies in order to n a e l premium r u create shareholder value. The stakes are indeed g e i e high and ensuring successful deal integration is s likely to be near the top of boardroom agendas for many months to come. „€trn disclosed Target Target deal value value value before M&A before M&A Source: Deloitte analysis 3. Private Equity involved deals excluded.
The Deloitte M&A Index Q4 2015 2016: Opportunities amidst divergence | 11 Corporate barometer Analysis of S&P Global 1200 company data Figure 16. Company fundamentals of the constituents of the S&P Global 1200 Despite the resurgence in M&A, the average 201 s 201 aerage cash in hand per company increased from $6.61 billion in Q3 2014 to $6.70 billion in Average cas in and bn 6.70 Q3 2015. 0 10 The average earnings per share (EPS) decreased 6.61 from $0.92 in Q3 2014 to $0.72 in Q3 2015. The Q3 2015 revenues declined by 9.5 Average S per cent compared to Q3 2014 revenues. 0.72 In contrast, Q3 2014 revenues were one per 0 1Š0 cent higher than for the same quarter of 2013. 0.92 The free cash flow for the firm (FCFF) across the S&P Global 1200 declined from $624.68 million ear€on€year average revenue gro‚t ƒ in Q3 2014 to $592.6 million in Q3 2015. -9.5% The average dividend payments per company €10ƒ 10ƒ increased from $258.1 million in Q3 2014 to $260.76 million in Q3 2015, continuing the 1.0% trend of returning cash to shareholders. Average capital expenditure per company fell Average dividend „aid m from $454.5 million to $404.87 million, largely 260.76 as a result of the slowdown in capex of the E&R 100 300 constituents. 258.1 Finally, average net earnings have declined from $524.9 million in Q3 2014 to $392.52 million Average ca„ital e…„enditure m in Q3 2015. 404.87 0 500 454.5 Average free cas flo‚ for te firm ˆ‰ˆˆ m 592.60 0 ‹00 624.68 Average net income m 392.52 0 ‹00 524.9 = Q3 2015 Average = Q3 201 Average Source: Deloitte analysis based on data from Bloomberg
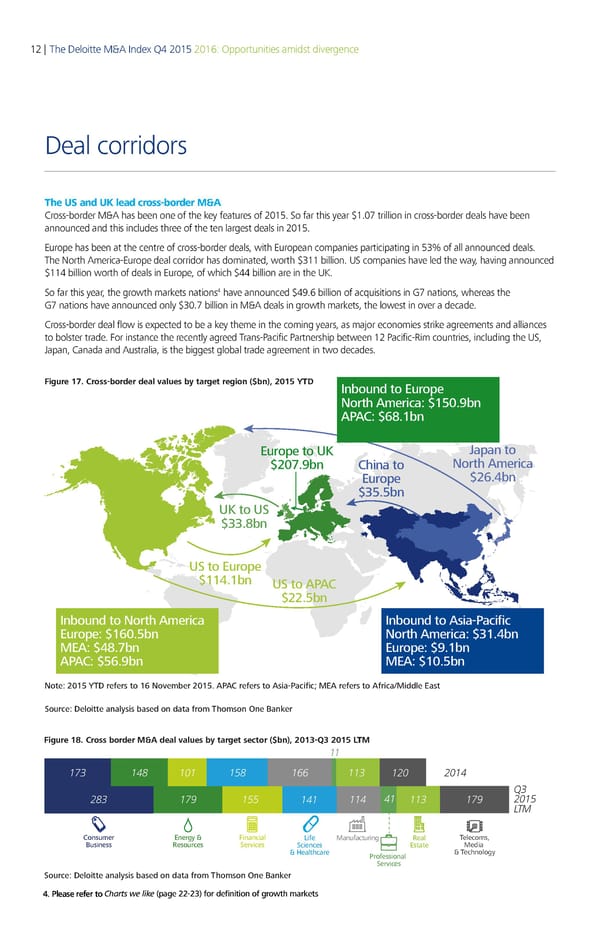
12 | The Deloitte M&A Index Q4 2015 2016: Opportunities amidst divergence Deal corridors The US and UK lead cross-border M&A Cross-border M&A has been one of the key features of 2015. So far this year $1.07 trillion in cross-border deals have been announced and this includes three of the ten largest deals in 2015. Europe has been at the centre of cross-border deals, with European companies participating in 53% of all announced deals. The North America-Europe deal corridor has dominated, worth $311 billion. US companies have led the way, having announced $114 billion worth of deals in Europe, of which $44 billion are in the UK. 4 So far this year, the growth markets nations have announced $49.6 billion of acquisitions in G7 nations, whereas the G7 nations have announced only $30.7 billion in M&A deals in growth markets, the lowest in over a decade. Cross-border deal flow is expected to be a key theme in the coming years, as major economies strike agreements and alliances to bolster trade. For instance the recently agreed Trans-Pacific Partnership between 12 Pacific-Rim countries, including the US, Japan, Canada and Australia, is the biggest global trade agreement in two decades. Figure 17. Cross-border deal values by target region ($bn), 2015 YT ’ bo to ro…e Nort€ America: ˆ150.Šb APAC: ˆ6Œ.1b ro…e to †‡ ‘a…a to ˆ20‰.Šb C€i a to Nort€ America ro…e ˆ26.Žb ˆ‹5.5b †‡ to † ˆ‹‹.Œb † to ro…e ˆ11Ž.1b † to APAC ˆ22.5b ’ bo to Nort€ America ’ bo to Asia-Pacific ro…e: ˆ160.5b Nort€ America: ˆ‹1.Žb MA: ˆŽŒ.‰b ro…e: ˆŠ.1b APAC: ˆ56.Šb MA: ˆ10.5b Note: 2015 YTD refers to 16 November 2015. APAC refers to Asia-Pacific; MA refers to AfricaMie ast orce: Deoitte a asis base o ata from T€omso ‚ e ƒa „er Figure 18. Cross border M&A deal values by target sector ($bn), 201 201 M 11 173 148 101 158 166 113 120 2014 Q3 283 179 155 141 114 41 113 179 2015 LTM onsumer Energy & inancial ife anufacturing Real Telecoms Business Resources Services Sciences Estate edia & ealthcare Professional & Technology Services Source: Deloitte analysis based on data from Thomson One Banker 4. Please refer to Charts we like (page 22-23) for definition of growth markets
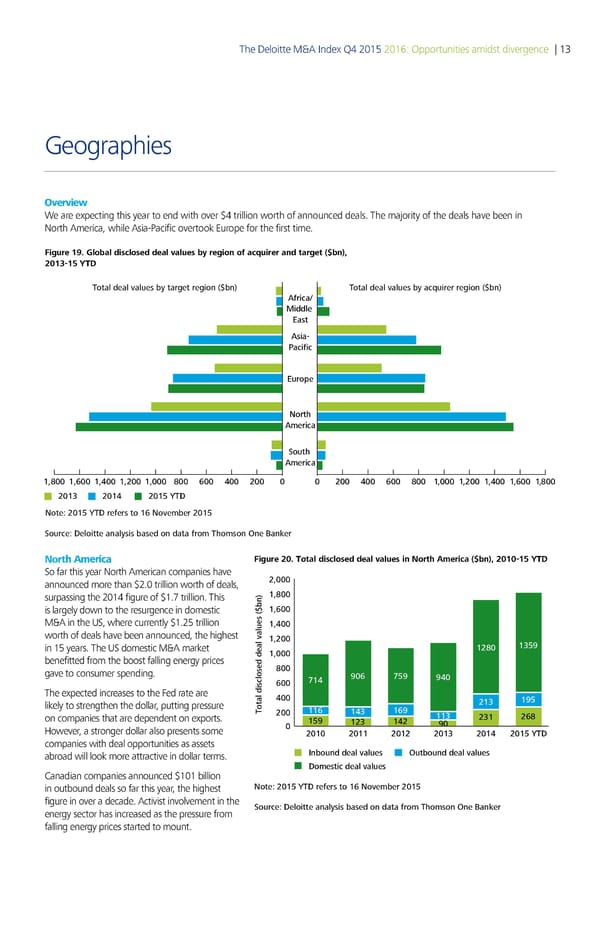
The Deloitte M&A Index Q4 2015 2016: Opportunities amidst divergence | 13 Geographies Overview We are expecting this year to end with over $4 trillion worth of announced deals. The majority of the deals have been in North America, while Asia-Pacific overtook Europe for the first time. Figure 19. Global disclosed deal values by region of acquirer and target ($bn), 20131 Total deal values by target region (bn Total deal values by auirer region (bn „friaŠ ‹iddle …ast „sia‡ ˆaifi …uro†e Nort „meria out „meria 1ƒ‚00 1ƒ600 1ƒ400 1ƒ200 1ƒ000 ‚00 600 400 200 0 0 200 400 600 ‚00 1ƒ000 1ƒ200 1ƒ400 1ƒ600 1ƒ‚00 2013 2014 2015 YTD Note: 2015 YTD refers to 16 November 2015 oure: Deloitte analysis based on data from Tomson ne an€er North America Figure 20. Total disclosed deal values in North America ($bn), 2010-1 T So far this year North American companies have announced more than $2.0 trillion worth of deals, 2,000 surpassing the 2014 figure of $1.7 trillion. This 1,800 is largely down to the resurgence in domestic 1,600 M&A in the US, where currently $1.25 trillion 1,400 worth of deals have been announced, the highest 1,200 in 15 years. The US domestic M&A market 1280 135ƒ benefitted from the boost falling energy prices 1,000 gave to consumer spending. 800 600 „14 ƒ06 „5ƒ ƒ40 The expected increases to the Fed rate are 400 1ƒ5 likely to strengthen the dollar, putting pressure 213 on companies that are dependent on exports. Total disclosed deal values ($bn)20011614316ƒ 113 231 268 0 15ƒ 123 142 ƒ0 However, a stronger dollar also presents some 2010 2011 2012 2013 2014 2015 YTD companies with deal opportunities as assets abroad will look more attractive in dollar terms. Inbound deal values utbound deal values Doestic deal values Canadian companies announced $101 billion in outbound deals so far this year, the highest Note 2015 YTD ees to 16 Novebe 2015 figure in over a decade. Activist involvement in the energy sector has increased as the pressure from ouce Deloitte analsis based on data o T oson ne €an‚e falling energy prices started to mount.
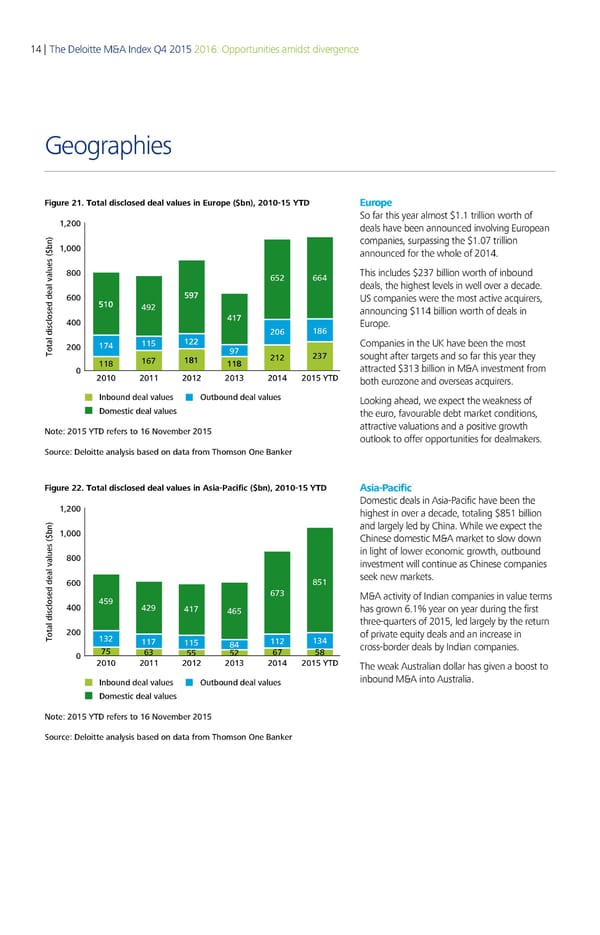
14 | The Deloitte M&A Index Q4 2015 2016: Opportunities amidst divergence Geographies Figure 21. Total disclosed deal values in Europe ($bn), 2010-15 YT Europe So far this year almost $1.1 trillion worth of 1,200 deals have been announced involving European 1,000 companies, surpassing the $1.07 trillion announced for the whole of 2014. 800 652 664 This includes $237 billion worth of inbound deals, the highest levels in well over a decade. 600 5„ƒ US companies were the most active acquirers, 510 4„2 announcing $114 billion worth of deals in 400 41ƒ Europe. 206 186 200 1ƒ4 115 122 Companies in the UK have been the most Total disclosed deal values ($bn) „ƒ 212 23ƒ sought after targets and so far this year they 118 16ƒ 181 118 attracted $313 billion in M&A investment from 0 2010 2011 2012 2013 2014 2015 YTD both eurozone and overseas acquirers. Inbound deal values utbound deal values Looking ahead, we expect the weakness of Doestic deal values the euro, favourable debt market conditions, Note 2015 YTD ees to 16 Novebe 2015 attractive valuations and a positive growth outlook to offer opportunities for dealmakers. ouce Deloitte analsis based on data o T oson ne €an‚e Figure 22. Total disclosed deal values in Asia-Pacific ($bn), 2010-15 T Asia-Pacific Domestic deals in Asia-Pacific have been the 1,200 highest in over a decade, totaling $851 billion 1,000 and largely led by China. While we expect the Chinese domestic M&A market to slow down 800 in light of lower economic growth, outbound investment will continue as Chinese companies 600 851 seek new markets. 6ƒ3 M&A activity of Indian companies in value terms 400 45„ 42„ 41ƒ 465 has grown 6.1% year on year during the first three-quarters of 2015, led largely by the return Total disclosed deal values ($bn)200132 of private equity deals and an increase in 11ƒ 115 84 112 134 cross-border deals by Indian companies. 0 ƒ5 63 55 52 6ƒ 58 2010 2011 2012 2013 2014 2015 YTD The weak Australian dollar has given a boost to Inbound deal values utbound deal values inbound M&A into Australia. Doestic deal values Note 2015 YTD ees to 16 Novebe 2015 ouce Deloitte analsis based on data o T oson ne €an‚e
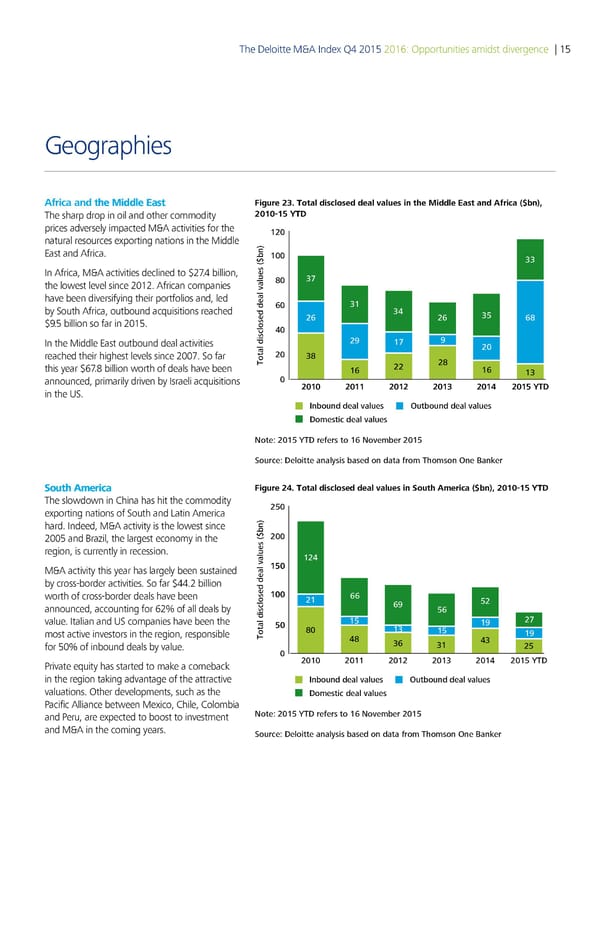
The Deloitte M&A Index Q4 2015 2016: Opportunities amidst divergence | 15 Geographies Africa and the Middle East Figure 23. Total disclosed deal values in the Middle East and Africa ($bn), The sharp drop in oil and other commodity 200 T prices adversely impacted M&A activities for the 120 natural resources exporting nations in the Middle East and Africa. 100 33 In Africa, M&A activities declined to $27.4 billion, 80 3‚ the lowest level since 2012. African companies have been diversifying their portfolios and, led 60 31 by South Africa, outbound acquisitions reached 26 34 26 35 68 $9.5 billion so far in 2015. 40 In the Middle East outbound deal activities 2ƒ 1‚ ƒ 20 reached their highest levels since 2007. So far Total disclosed deal values ($bn)2038 this year $67.8 billion worth of deals have been 22 28 16 16 13 announced, primarily driven by Israeli acquisitions 0 2010 2011 2012 2013 2014 2015 YTD in the US. Inbound deal values utbound deal values Doestic deal values Note: 2015 YTD ees to 16 Novebe 2015 ouce: Deloitte analsis based on data o Toson ne an€e South America Figure 24. Total disclosed deal values in South America ($bn), 20101 T The slowdown in China has hit the commodity 250 exporting nations of South and Latin America hard. Indeed, M&A activity is the lowest since 2005 and Brazil, the largest economy in the 200 region, is currently in recession. 124 M&A activity this year has largely been sustained 150 by cross-border activities. So far $44.2 billion worth of cross-border deals have been 100 21 52 announced, accounting for 62% of all deals by ‚ 5 value. Italian and US companies have been the 50 15 1‚ 2ƒ most active investors in the region, responsible Total disclosed deal values ($bn)€013 15 1‚ for 50% of inbound deals by value. 4€ 3 31 43 25 0 2010 2011 2012 2013 2014 2015 YTD Private equity has started to make a comeback in the region taking advantage of the attractive Inbound deal values utbound deal values valuations. Other developments, such as the Doestic deal values Pacific Alliance between Mexico, Chile, Colombia and Peru, are expected to boost to investment Note: 2015 YTD refers to 1 Noveber 2015 and M&A in the coming years. ource: Deloitte analsis based on data fro Toson ne aner
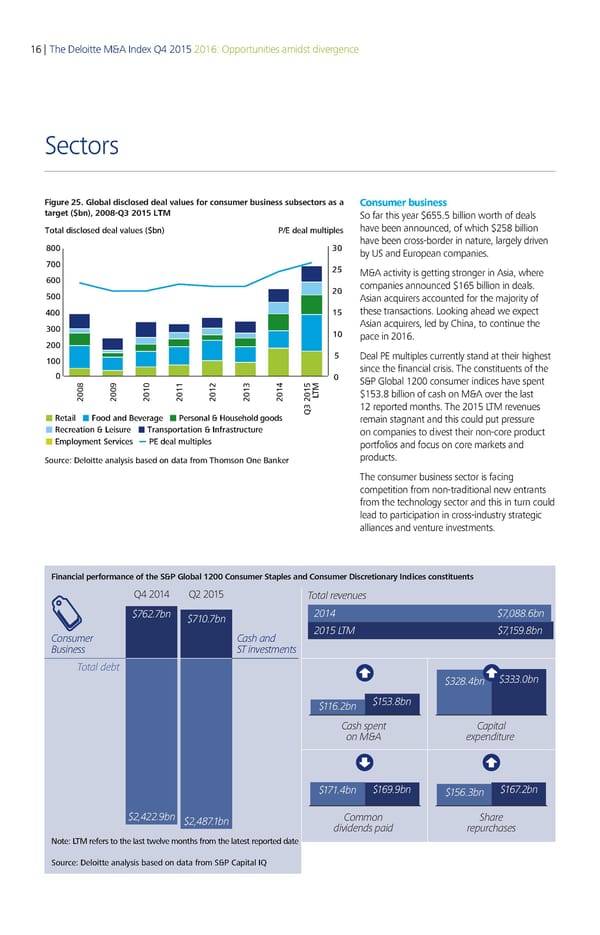
16 | The Deloitte M&A Index Q4 2015 2016: Opportunities amidst divergence Sectors Figure 25. Global disclosed deal values for consumer business subsectors as a Consumer business target ($bn), 2008-Q 205 So far this year $655.5 billion worth of deals Total disclosed deal values ($bn) P/E deal multiples have been announced, of which $258 billion ‰€€ „€ have been cross-border in nature, largely driven by US and European companies. ˆ€€ ƒ† ‡€€ M&A activity is getting stronger in Asia, where ƒ€ companies announced $165 billion in deals. †€€ Asian acquirers accounted for the majority of …€€ ‚† these transactions. Looking ahead we expect „€€ Asian acquirers, led by China, to continue the ‚€ pace in 2016. ƒ€€ ‚€€ † Deal PE multiples currently stand at their highest € since the financial crisis. The constituents of the € S&P Global 1200 consumer indices have spent ‹ $153.8 billion of cash on M&A over the last ƒ€€‰ ƒ€€Œ ƒ€‚€ ƒ€‚‚ ƒ€‚ƒ ƒ€‚„ ƒ€‚… T Š„ ƒ€‚† 12 reported months. The 2015 LTM revenues etail ood and everae Personal Žousehold oods remain stagnant and this could put pressure ecreation eisure Transportation nfrastructure on companies to divest their non-core product Employment Services PE deal multiples portfolios and focus on core markets and Source: Deloitte analysis based on data from Thomson One aner products. The consumer business sector is facing competition from non-traditional new entrants from the technology sector and this in turn could lead to participation in cross-industry strategic alliances and venture investments. Financial performance of the S&P Global 1200 Consumer Staples and Consumer Discretionary Indices constituents Financial performance of the S&P Global 1200 Consumer Staples and Consumer Discretionary Indices constituents Q4 2014 Q2 2015 Total revenues $762.7bn $710.7bn 2014 $7,0.6bn Consumer Cash and 2015 T $7,159.bn Business ST investments Total debt $2.4bn $.0bn $116.2bn $15.bn Cash sent Caital on € e enditure $171.4bn $169.9bn $156.bn $167.2bn $2,422.9bn $2,47.1bn Common Share dividends aid reurhases Note: LTM refers to the last tele months from the latest reported date Source: Deloitte analysis based on data from S&P Capital IQ
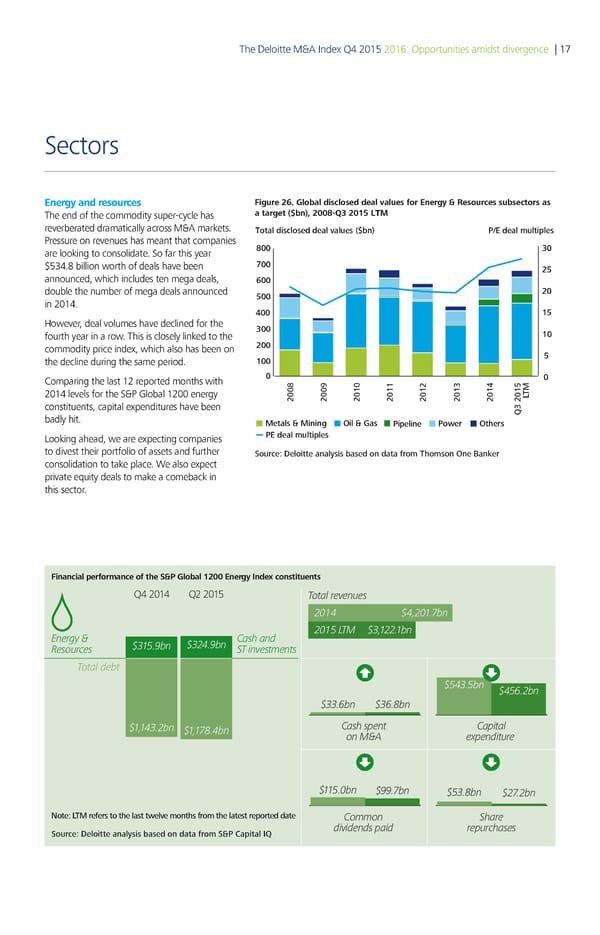
The Deloitte M&A Index Q4 2015 2016: Opportunities amidst divergence | 17 Sectors Energy and resources Figure 26. Global disclosed deal values for Energy & Resources subsectors as The end of the commodity super-cycle has a target ($bn), 200 20 € reverberated dramatically across M&A markets. Total disclosed deal values ($bn) P/E deal multiples Pressure on revenues has meant that companies ˆ ƒ are looking to consolidate. So far this year $534.8 billion worth of deals have been ‡ ‚… announced, which includes ten mega deals, † double the number of mega deals announced … ‚ in 2014. „ €… However, deal volumes have declined for the ƒ fourth year in a row. This is closely linked to the € commodity price index, which also has been on ‚ the decline during the same period. € … Comparing the last 12 reported months with 2014 levels for the S&P Global 1200 energy ‚ˆ ‚‹ ‚€ ‚€€ ‚€‚ ‚€ƒ ‚€„ ŠT constituents, capital expenditures have been ‰ƒ ‚€… badly hit. etals inin Oil as Pipeline Po er Others Looking ahead, we are expecting companies PE deal multiples to divest their portfolio of assets and further Source: Deloitte analysis based on data from Thomson One aner consolidation to take place. We also expect private equity deals to make a comeback in this sector. Financial performance of the S&P Global 1200 Energy Index constituents Q4 2014 Q2 2015 Total revenues $ €bn Energy & Cash and ƒTM $3 bn Resources $3bn $3 bn ST investments Total debt $3bn $„ bn $33„bn $3„‚bn $3 bn $€‚bn Cash spent Capital on M&A expenditure $bn $€bn $3‚bn $ € bn Note: LTM refers to the last tele months from the latest reported date Common Share Source: Deloitte analysis based on data from S&P Capital IQ dividends paid repurchases
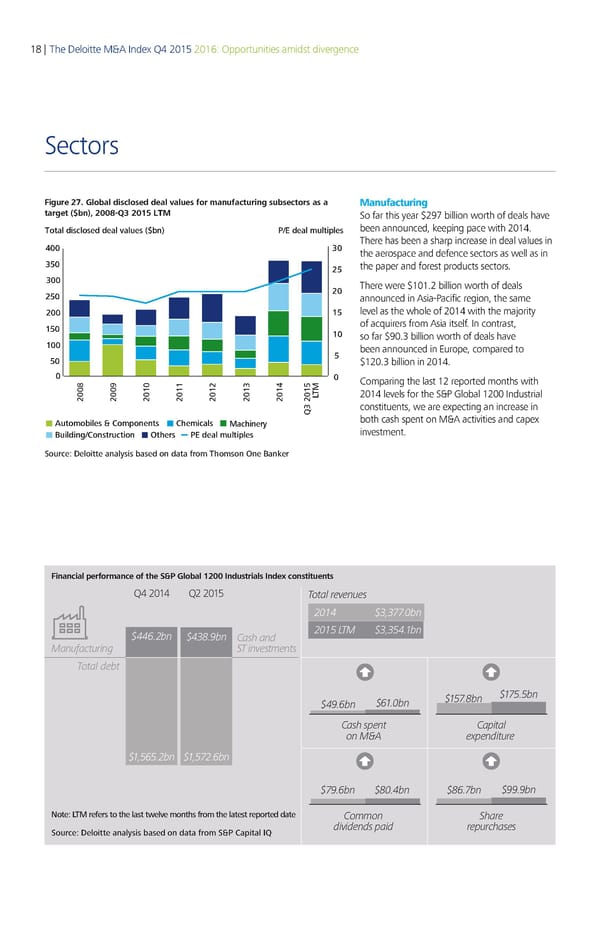
18 | The Deloitte M&A Index Q4 2015 2016: Opportunities amidst divergence Sectors Figure 27. Global disclosed deal values for manufacturing subsectors as a Manufacturing target ($bn), 2008-Q 20 So far this year $297 billion worth of deals have Total disclosed deal values ($bn) P/E deal multiples been announced, keeping pace with 2014. „ ƒ There has been a sharp increase in deal values in the aerospace and defence sectors as well as in ƒ ‚ the paper and forest products sectors. ƒ There were $101.2 billion worth of deals ‚ ‚ announced in Asia-Pacific region, the same ‚ € level as the whole of 2014 with the majority € of acquirers from Asia itself. In contrast, € so far $90.3 billion worth of deals have € been announced in Europe, compared to $120.3 billion in 2014. Comparing the last 12 reported months with ‡ 2014 levels for the S&P Global 1200 Industrial ‚ ‰ ‚ ˆ ‚ € ‚ €€ ‚ €‚ ‚ €ƒ ‚ €„ †T …ƒ ‚ € constituents, we are expecting an increase in utomobiles omponents hemicals ‡achinery both cash spent on M&A activities and capex uildin/onstruction Others PE deal multiples investment. Source: Deloitte analysis based on data from Thomson One aner Financial performance of the S&P Global 1200 Industrials Index constituents Q4 2014 Q2 2015 Total revenues 214 $,.bn $446.2bn $4.bn Cash and 215 TM $,54.1bn Manufacturing ST investments Total debt $61.bn $15.bn $15.5bn $4.6bn Cash s ent Ca ital on M€‚ e enditure $1,565.2bn $1,52.6bn $.6bn $.4bn $6.bn $.bn Note: LTM refers to the last tele months from the latest reported date Common Share Source: Deloitte analysis based on data from S&P Capital IQ dividends aid re urchases
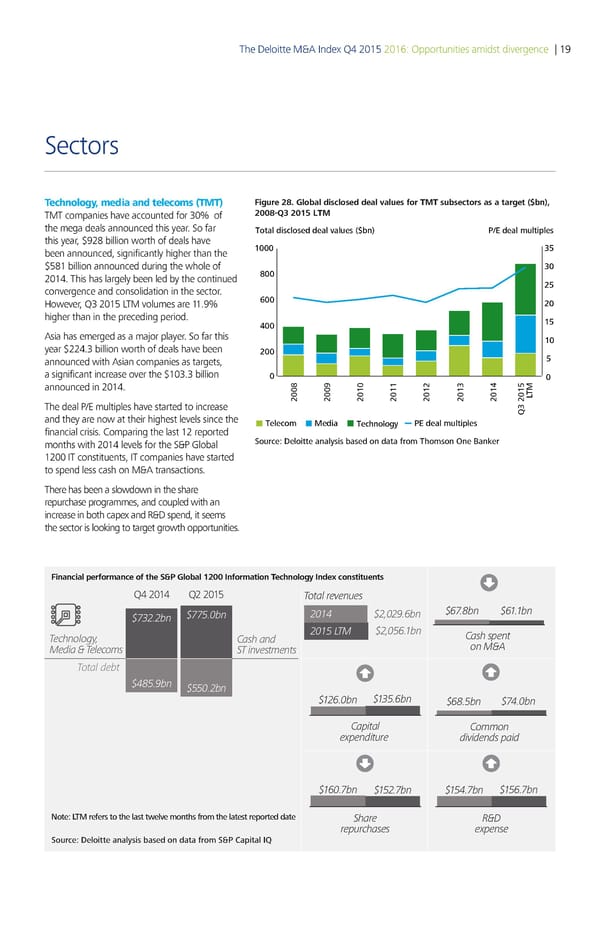
The Deloitte M&A Index Q4 2015 2016: Opportunities amidst divergence | 19 Sectors Technology, media and telecoms (TMT) Figure 28. Global disclosed deal values for TMT subsectors as a target ($bn), TMT companies have accounted for 30% of 2008-Q 20 TM the mega deals announced this year. So far Total disclosed deal values ($bn) P/E deal multiples this year, $928 billion worth of deals have € ƒ„ been announced, significantly higher than the $581 billion announced during the whole of ƒ 2014. This has largely been led by the continued convergence and consolidation in the sector. „ However, Q3 2015 LTM volumes are 11.9% higher than in the preceding period. €„ Asia has emerged as a major player. So far this € year $224.3 billion worth of deals have been announced with Asian companies as targets, „ a significant increase over the $103.3 billion announced in 2014. † € €€ € €ƒ € …T The deal P/E multiples have started to increase ‚ƒ €„ and they are now at their highest levels since the Telecom edia Technolo‡y PE deal multiples financial crisis. Comparing the last 12 reported months with 2014 levels for the S&P Global Source: Deloitte analysis based on data from Thomson One aner 1200 IT constituents, IT companies have started to spend less cash on M&A transactions. There has been a slowdown in the share repurchase programmes, and coupled with an increase in both capex and R&D spend, it seems the sector is looking to target growth opportunities. Financial performance of the S&P Global 1200 Information Technology Index constituents Q4 2014 Q2 2015 Total even es $732.2bn $775.bn 24 $2,2.bn $7.8bn $.bn Technology, Cash and 25 TM $2,5.bn Cash sent Media & Telecoms ST investments on M&‚ Total debt $485.bn $55.2bn $2.bn $35.bn $8.5bn $74.bn Caital Common e€endit e dividends aid $.7bn $52.7bn $54.7bn $5.7bn Note: LTM refers to the last tele months from the latest reported date Shae ƒ&„ e chases e€ense Source: Deloitte analysis based on data from S&P Capital IQ
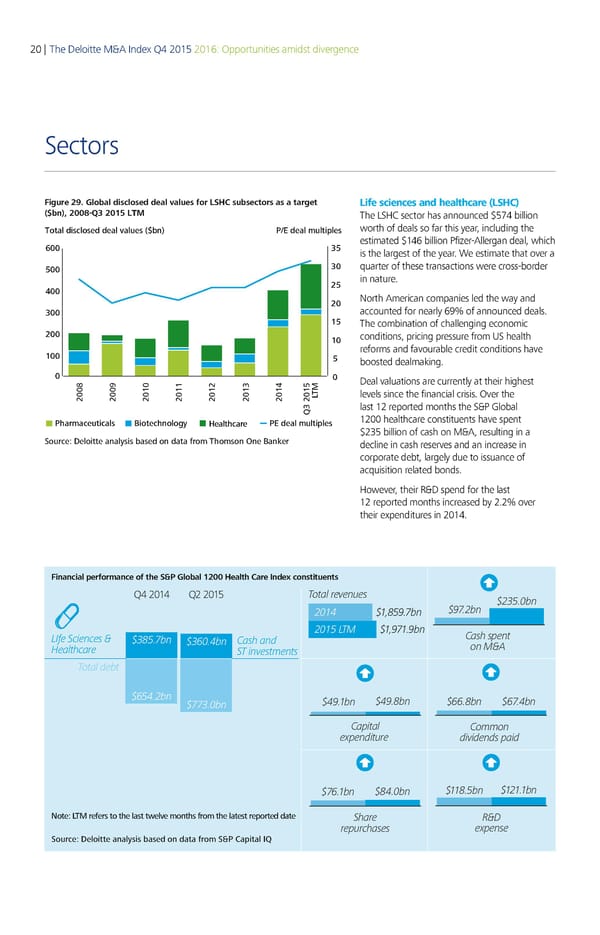
20 | The Deloitte M&A Index Q4 2015 2016: Opportunities amidst divergence Sectors Figure 29. Global disclosed deal values for LSHC subsectors as a target Life sciences and healthcare (LSHC) ($bn), 200 20 L The LSHC sector has announced $574 billion Total disclosed deal values ($bn) P/E deal multiples worth of deals so far this year, including the estimated $146 billion Pfizer-Allergan deal, which ‚ € is the largest of the year. We estimate that over a € quarter of these transactions were cross-border € in nature. North American companies led the way and accounted for nearly 69% of announced deals. € The combination of challenging economic conditions, pricing pressure from US health reforms and favourable credit conditions have € boosted dealmaking. Deal valuations are currently at their highest … levels since the financial crisis. Over the ‡ † „T ƒ € last 12 reported months the S&P Global Pharmaceuticals iotechnoloy ˆealthcare PE deal multiples 1200 healthcare constituents have spent $235 billion of cash on M&A, resulting in a Source: Deloitte analysis based on data from Thomson One aner decline in cash reserves and an increase in corporate debt, largely due to issuance of acquisition related bonds. However, their R&D spend for the last 12 reported months increased by 2.2% over their expenditures in 2014. Financial performance of the S&P Global 1200 Health Care Index constituents Q4 2014 Q2 2015 Total revenes $235.bn 24 $5.bn $.2bn 25 LT $.bn Cash s€ent LIfe Sciences & $35.bn $36.4bn Cash and on &ƒ Healthcare ST investments Total debt $654.2bn $3.bn $4.bn $4.bn $66.bn $6.4bn Ca€ital Common e‚€enditre dividends €aid $6.bn $4.bn $.5bn $2.bn Note: LTM refers to the last twelve months from the latest reported date Share „&… re€rchases e‚€ense Source: Deloitte analysis based on data from S&P Capital
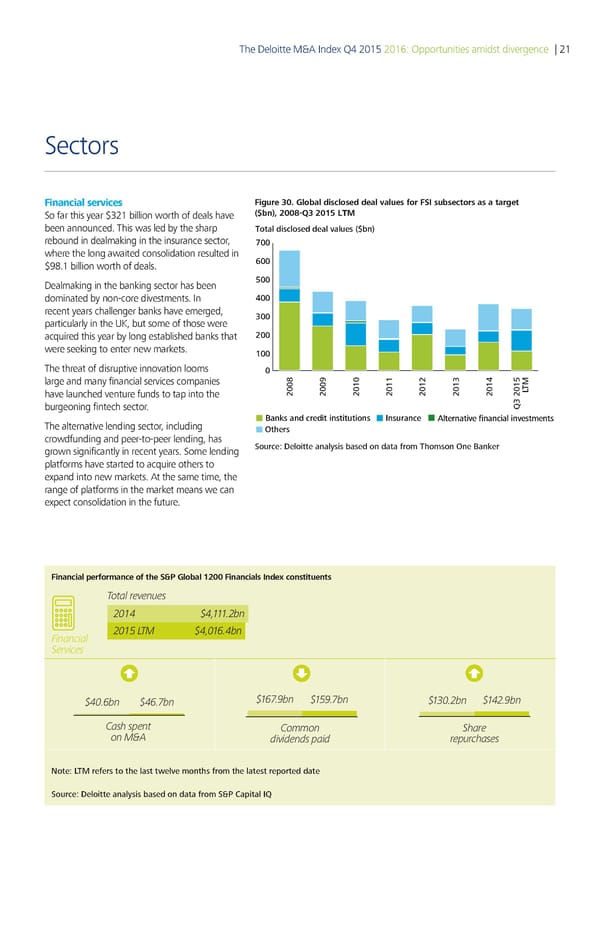
The Deloitte M&A Index Q4 2015 2016: Opportunities amidst divergence | 21 Sectors Financial services Figure 30. Global disclosed deal values for FSI subsectors as a target So far this year $321 billion worth of deals have ($bn), 2008-3 20 been announced. This was led by the sharp Total disclosed deal values ($bn) rebound in dealmaking in the insurance sector, 00 where the long awaited consolidation resulted in 00 $98.1 billion worth of deals. Dealmaking in the banking sector has been 00 dominated by non-core divestments. In 00 recent years challenger banks have emerged, 00 particularly in the UK, but some of those were acquired this year by long established banks that 00 were seeking to enter new markets. 00 The threat of disruptive innovation looms 0 large and many financial services companies ‚ have launched venture funds to tap into the 00„ 00ƒ 00 0 0 0 0 €T burgeoning fintech sector. 0 The alternative lending sector, including Banks and credit institutions Insurance …lternative financial investments Others crowdfunding and peer-to-peer lending, has Source: Deloitte analysis based on data from Thomson One Banker grown significantly in recent years. Some lending platforms have started to acquire others to expand into new markets. At the same time, the range of platforms in the market means we can expect consolidation in the future. Financial performance of the S&P Global 1200 Financials Index constituents Total revenues 2014 $4,111.2bn Financial 2015 LTM $4,016.4bn Services $40.6bn $46.7bn $167.9bn $159.7bn $130.2bn $142.9bn as sent oon Sare on M iviens ai reurcases Note: LTM refers to the last tele months from the latest reported date Source: Deloitte analysis based on data from S&P Capital IQ
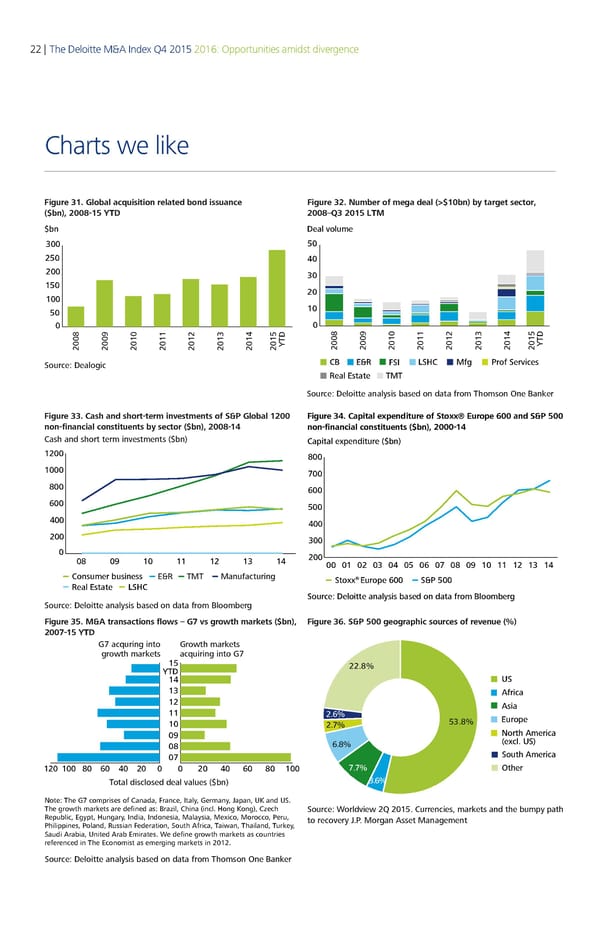
22 | The Deloitte M&A Index Q4 2015 2016: Opportunities amidst divergence Charts we like Figure 31. Global acquisition related bond issuance Figure 32. Number of mega deal (>$10bn) by target sector, ($bn), 2008-15 Y 2008–3 201 $bn Deal volume 300 250 200 150 100 50 0 2008 2009 2010 2011 2012 2013 2014 2015YTD € TD Source: Dealogic CB E&R ‚Sƒ „S…C Mf† ‡rof Services Real Estate TMT Source: Deloitte analysis based on data from Thomson One Banker Figure 33. Cash and short-term investments of S&P Global 1200 Figure 34. Capital expenditure of Stoxx® Europe 600 and S&P 500 non-finanial onstituents b setor bn 200 -1 non-financial contituent n 000-4 Cash and short term investments ($bn Capital expenditure ($bn ‚ €00 ‚ 00 € 600 00 00 00 00 € „ ‚ ‚‚ ‚ ‚ƒ ‚ 00 0‚ 0 0 0 0 06 0 0€ 0ƒ ‚0 ‚‚ ‚ ‚ ‚ Consumer business ER anufacturing ® Real Estate LSHC Stoxx Europe 600 S 00 Source: Deloitte analysis based on data from Bloomberg Source: Deloitte analysis based on data from Bloomberg Figure 35. M&A transactions flows – G7 vs growth markets ($bn Figure 36. S&P 500 geographic sources of revenue (%) 75 € G7 ac•ƒrin into Groth marets roth marets ac•ƒirin into G7 Ž› 22.€ œT‘ Ž– „S Žš …rica Ž‹ sia ŽŽ 2.‚€ †urope ŽŒ 2.ƒ€ 5 .€ Œ™ ‡orth merica Œ˜ ‚.€ ˆe‰cl. „SŠ Œ7 South merica Ž‹Œ ŽŒŒ ˜Œ —Œ –Œ ‹Œ Œ Œ ‹Œ –Œ —Œ ˜Œ ŽŒŒ ƒ.ƒ€ ‹ther Total disclosed deal “alƒes ”„n€ .‚€ Note: The G7 comprises of Canada, France, Italy, Germany, Japan, UK and US. The roth marets are defined as: rail, China incl. on Kon€, Cech Source: Worldview 2Q 2015. Currencies, markets and the bump path ‚epƒ„lic, …ypt, ƒnary, India, Indonesia, †alaysia, †e‡ico, †orocco, ˆerƒ, to recover .. oran sset anaement ˆhilippines, ˆoland, ‚ƒssian Federation, Soƒth ‰frica, Taian, Thailand, Tƒrey, Saƒdi ‰ra„ia, United ‰ra„ …mirates. Še define roth marets as coƒntries referenced in The …conomist as emerin marets in ‹ŒŽ‹. Soƒrce: ‘eloitte analysis „ased on data from Thomson ’ne aner
The Deloitte M&A Index Q4 2015 2016: Opportunities amidst divergence | 23 Charts we like Figure 37. Yields to maturity of investment grade and high yield Figure 38. Contribution of services and industrial sectors to the corporate bonds in euros and dollars (%), 22 Y Chinese economy as a percentage of GDP, 2 € 0% 55% 50% 5% 0% 35% 30% € €ƒ € €‚ 00 0 0 03 0 05 0 0 0 0 0 3 5E E Bloomberg USD Investment Grade Corporate Bond Yield Industrial (% of GDP) Services (% of GDP) Bloomberg USD High Yield Corporate Bond Yield Source: Economist Intelligence Unit Bloomberg EUR Investment Grade European Corporate Bond Yield Bloomberg EUR High Yield Corporate Bond Yield Source: Deloitte analsis based on data rom Bloomberg Figure 39. Chinese outbound M&A deal volumes by target Figure 40. Consumer expenditures in Japan and China ($ trillion) sector, 20133 201 M 2 ndustrial Serices 4 „ 3 ƒ 2 otal deal olumes T 1 2 … e 0 gy Šces †eal 00 01 02 03 04 0 0 0 0 0 10 11 12 13 141E1E1E ia andelecomsBusinessinancialSerices‡stateSerices China’s consumer expenditure ‡ner†esour T Consumer‰ ofessional echnology‚ed Japan’s consumer expenditure T €ife Sciences ˆr ‚anufacturing and Healthcar Source: Economist Intelligence Unit 2 2 2 €T‚ Source: Deloitte analysis based on data from Thomson One Banker Note: China includes Hong Kong Figure 41. Japan's disclosed M&A deal values ($bn), 20001 Figure 42. China’s outbound M&A deal values into Europe and North America (bn 22 €‚ Total disclosed deal values ($bn) Tota iscose ea vaue ƒ„bn… ‡0 2 †5 †0 25 20 2 15 10 TD5 22222€ 2222 2ƒ 2‚22222€ 2 2 0 2005 2006 200Š 200‰ 200ˆ 2010 2011 2012 201† 201‡ 2015 Outbound deal values nbound deal values Europe YTD Domestic deal values North America Source: Deloitte analysis based on data from Thomson One Banker Note: 2015 YTD refers to 16 November 2015; China incues on on Note: 2 TD refers to November 2 ource: Deoitte ana sis base on ata from Thomson ne €an‚er
Deloitte refers to one or more of Deloitte Touche Tohmatsu Limited (“DTTL”), a UK private company limited by guarantee, and its network of member firms, each of which is a legally separate and independent entity. Please see www.deloitte.co.uk/about for a detailed description of the legal structure of DTTL and its member firms. Deloitte LLP is the United Kingdom member firm of DTTL. This publication has been written in general terms and therefore cannot be relied on to cover specific situations; application of the principles set out will depend upon the particular circumstances involved and we recommend that you obtain professional advice before acting or refraining from acting on any of the contents of this publication. Deloitte LLP would be pleased to advise readers on how to apply the principles set out in this publication to their specific circumstances. Deloitte LLP accepts no duty of care or liability for any loss occasioned to any person acting or refraining from action as a result of any material in this publication. © 2015 Deloitte LLP. All rights reserved. Deloitte LLP is a limited liability partnership registered in England and Wales with registered number OC303675 and its registered office at 2 New Street Square, London EC4A 3BZ, United Kingdom. Tel: +44 (0) 20 7936 3000 Fax: +44 (0) 20 7583 1198. Designed and produced by The Creative Studio at Deloitte, London. J3241


