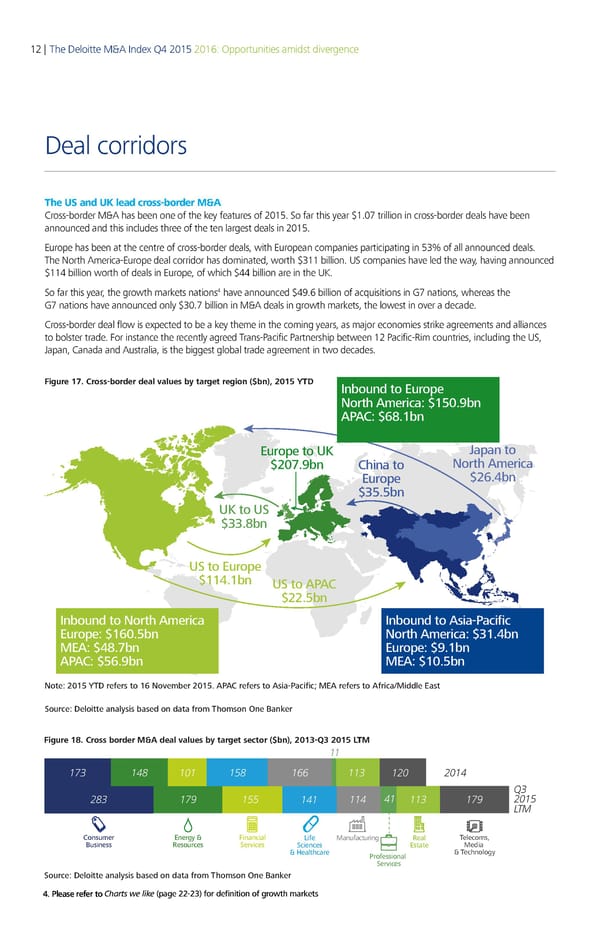
12 | The Deloitte M&A Index Q4 2015 2016: Opportunities amidst divergence Deal corridors The US and UK lead cross-border M&A Cross-border M&A has been one of the key features of 2015. So far this year $1.07 trillion in cross-border deals have been announced and this includes three of the ten largest deals in 2015. Europe has been at the centre of cross-border deals, with European companies participating in 53% of all announced deals. The North America-Europe deal corridor has dominated, worth $311 billion. US companies have led the way, having announced $114 billion worth of deals in Europe, of which $44 billion are in the UK. 4 So far this year, the growth markets nations have announced $49.6 billion of acquisitions in G7 nations, whereas the G7 nations have announced only $30.7 billion in M&A deals in growth markets, the lowest in over a decade. Cross-border deal flow is expected to be a key theme in the coming years, as major economies strike agreements and alliances to bolster trade. For instance the recently agreed Trans-Pacific Partnership between 12 Pacific-Rim countries, including the US, Japan, Canada and Australia, is the biggest global trade agreement in two decades. Figure 17. Cross-border deal values by target region ($bn), 2015 YT ’ bo to ro…e Nort€ America: ˆ150.Šb APAC: ˆ6Œ.1b ro…e to †‡ ‘a…a to ˆ20‰.Šb C€i a to Nort€ America ro…e ˆ26.Žb ˆ‹5.5b †‡ to † ˆ‹‹.Œb † to ro…e ˆ11Ž.1b † to APAC ˆ22.5b ’ bo to Nort€ America ’ bo to Asia-Pacific ro…e: ˆ160.5b Nort€ America: ˆ‹1.Žb MA: ˆŽŒ.‰b ro…e: ˆŠ.1b APAC: ˆ56.Šb MA: ˆ10.5b Note: 2015 YTD refers to 16 November 2015. APAC refers to Asia-Pacific; MA refers to AfricaMie ast orce: Deoitte a asis base o ata from T€omso ‚ e ƒa „er Figure 18. Cross border M&A deal values by target sector ($bn), 201 201 M 11 173 148 101 158 166 113 120 2014 Q3 283 179 155 141 114 41 113 179 2015 LTM onsumer Energy & inancial ife anufacturing Real Telecoms Business Resources Services Sciences Estate edia & ealthcare Professional & Technology Services Source: Deloitte analysis based on data from Thomson One Banker 4. Please refer to Charts we like (page 22-23) for definition of growth markets
 Deloitte M&A Index | Report Page 14 Page 16