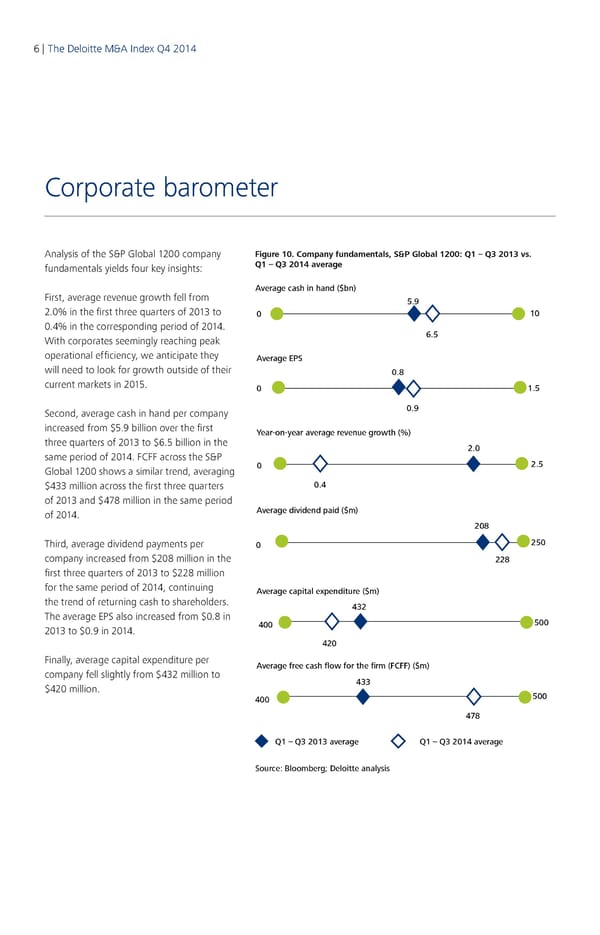
6 | The Deloitte M&A Index Q4 2014 7 | Corporate barometer Analysis of the S&P Global 1200 company Figure 10. Company fundamentals, S&P Global 1200: Q1 – Q3 2013 vs. fundamentals yields four key insights: Q1 – Q3 2014 average Average cash in hand ($bn) First, average revenue growth fell from 5.9 2.0% in the first three quarters of 2013 to 0 10 0.4% in the corresponding period of 2014. With corporates seemingly reaching peak 6.5 operational efficiency, we anticipate they Average EPS will need to look for growth outside of their 0.8 current markets in 2015. 0 1.5 Second, average cash in hand per company 0.9 increased from $5.9 billion over the first Year-on-year average revenue growth (%) three quarters of 2013 to $6.5 billion in the 2.0 same period of 2014. FCFF across the S&P 2.5 Global 1200 shows a similar trend, averaging 0 $433 million across the first three quarters 0.4 of 2013 and $478 million in the same period of 2014. Average dividend paid ($m) 208 Third, average dividend payments per 0 250 company increased from $208 million in the 228 first three quarters of 2013 to $228 million for the same period of 2014, continuing Average capital expenditure ($m) the trend of returning cash to shareholders. 432 The average EPS also increased from $0.8 in 500 2013 to $0.9 in 2014. 400 420 Finally, average capital expenditure per Average free cash flow for the firm (FCFF) ($m) company fell slightly from $432 million to 433 $420 million. 500 400 478 Q1 – Q3 2013 average Q1 – Q3 2014 average Source: Bloomberg; Deloitte analysis
 Q4 2014 The Deloitte M&A Index Page 5 Page 7