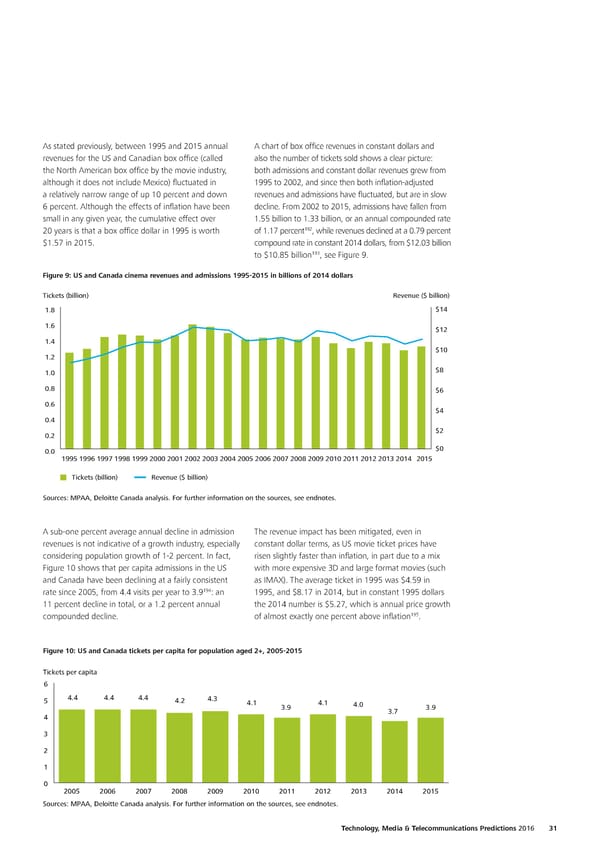
As stated previously, between 1995 and 2015 annual A chart of box office revenues in constant dollars and revenues for the US and Canadian box office (called also the number of tickets sold shows a clear picture: the North American box office by the movie industry, both admissions and constant dollar revenues grew from although it does not include Mexico) fluctuated in 1995 to 2002, and since then both inflation-adjusted a relatively narrow range of up 10 percent and down revenues and admissions have fluctuated, but are in slow 6 percent. Although the effects of inflation have been decline. From 2002 to 2015, admissions have fallen from small in any given year, the cumulative effect over 1.55 billion to 1.33 billion, or an annual compounded rate 192 20 years is that a box office dollar in 1995 is worth of 1.17 percent , while revenues declined at a 0.79 percent $1.57 in 2015. compound rate in constant 2014 dollars, from $12.03 billion 193 to $10.85 billion , see Figure 9. Figure 9: US and Canada cinema revenues and admissions 1995‑2015 in billions of 2014 dollars Tickets (billion) Revenue ($ billion) 1.8 $14 1.6 $12 1.4 $10 1.2 1.0 $8 0.8 $6 0.6 $4 0.4 0.2 $2 0.0 $0 19951996199719981999200020012002200320042005200620072008200920102011201220132014 2015 Tickets (billion) Revenue ($ billion) Sources: MPAA, Deloitte Canada analysis. For further information on the sources, see endnotes. A sub-one percent average annual decline in admission The revenue impact has been mitigated, even in revenues is not indicative of a growth industry, especially constant dollar terms, as US movie ticket prices have considering population growth of 1-2 percent. In fact, risen slightly faster than inflation, in part due to a mix Figure 10 shows that per capita admissions in the US with more expensive 3D and large format movies (such and Canada have been declining at a fairly consistent as IMAX). The average ticket in 1995 was $4.59 in 194 rate since 2005, from 4.4 visits per year to 3.9 : an 1995, and $8.17 in 2014, but in constant 1995 dollars 11 percent decline in total, or a 1.2 percent annual the 2014 number is $5.27, which is annual price growth 195 compounded decline. of almost exactly one percent above inflation . Figure 10: US and Canada tickets per capita for population aged 2+, 2005‑2015 Tickets per capita 6 5 4.4 4.4 4.4 4.2 4.3 4.1 4.1 3.9 4.0 3.9 4 3.7 3 2 1 0 2005 2006 2007 2008 2009 2010 2011 2012 2013 2014 2015 Sources: MPAA, Deloitte Canada analysis. For further information on the sources, see endnotes. Technology, Media & Telecommunications Predictions 2016 31
 Technology, Media & Telecommunications Predictions Page 37 Page 39