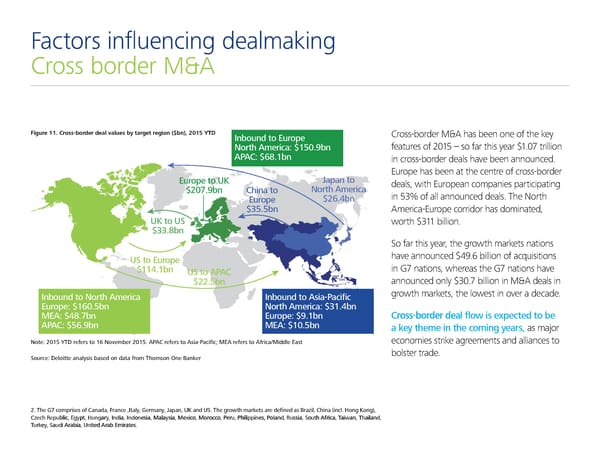
Factors influencing dealmaking Cross border M&A Figure 11. Cross-border deal values by target region ($bn), 2015 YTD ’ bo to ro…e Cross-border M&A has been one of the key Nort€ America: ˆ150.Šb features of 2015 – so far this year $1.07 trillion APAC: ˆ6Œ.1b in cross-border deals have been announced. Europe has been at the centre of cross-border ro…e to †‡ ‘a…a to deals, with European companies participating ˆ20‰.Šb C€i a to Nort€ America in 53% of all announced deals. The North ro…e ˆ26.Žb ˆ‹5.5b America-Europe corridor has dominated, †‡ to † worth $311 billion. ˆ‹‹.Œb So far this year, the growth markets nations † to ro…e have announced $49.6 billion of acquisitions ˆ11Ž.1b † to APAC in G7 nations, whereas the G7 nations have ˆ22.5b announced only $30.7 billion in M&A deals in ’ bo to Nort€ America ’ bo to Asia-Pacific growth markets, the lowest in over a decade. ro…e: ˆ160.5b Nort€ America: ˆ‹1.Žb MA: ˆŽŒ.‰b ro…e: ˆŠ.1b Cross-border deal flow is expected to be APAC: ˆ56.Šb MA: ˆ10.5b a key theme in the coming years, as major Note: 2015 YTD refers to 16 November 2015. APAC refers to Asia-Pacific; MA refers to AfricaMie ast economies strike agreements and alliances to orce: Deoitte a asis base o ata from T€omso ‚ e ƒa „er bolster trade. 2. The G7 comprises of Canada, France ,Italy, Germany, Japan, UK and US. The growth markets are defined as Brazil, China (incl. Hong Kong), Czech Republic, Egypt, Hungary, India, Indonesia, Malaysia, Mexico, Morocco, Peru, Philippines, Poland, Russia, South Africa, Taiwan, Thailand, Turkey, Saudi Arabia, United Arab Emirates.
 Deloitte M&A Index | Presentation Page 9 Page 11