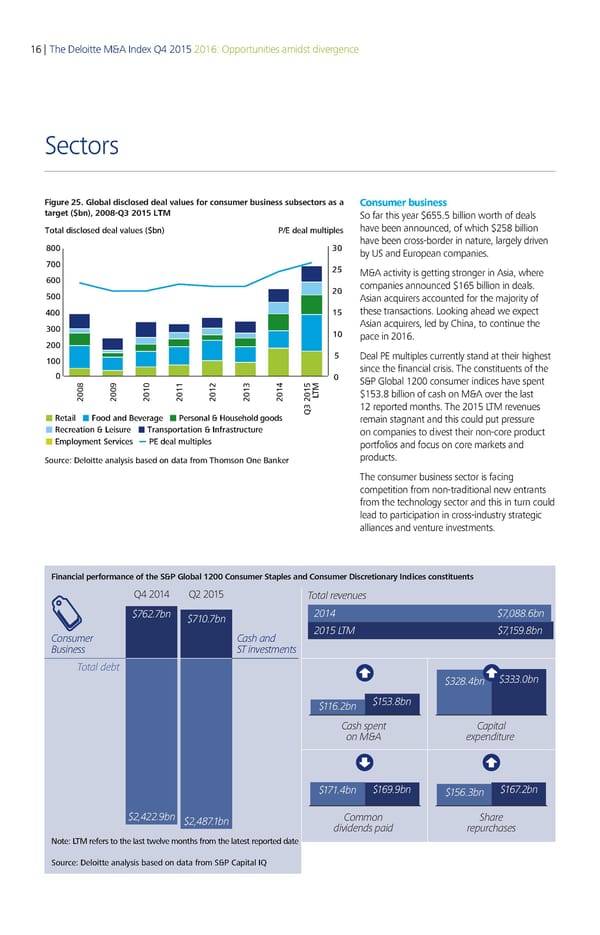
16 | The Deloitte M&A Index Q4 2015 2016: Opportunities amidst divergence Sectors Figure 25. Global disclosed deal values for consumer business subsectors as a Consumer business target ($bn), 2008-Q 205 So far this year $655.5 billion worth of deals Total disclosed deal values ($bn) P/E deal multiples have been announced, of which $258 billion ‰€€ „€ have been cross-border in nature, largely driven by US and European companies. ˆ€€ ƒ† ‡€€ M&A activity is getting stronger in Asia, where ƒ€ companies announced $165 billion in deals. †€€ Asian acquirers accounted for the majority of …€€ ‚† these transactions. Looking ahead we expect „€€ Asian acquirers, led by China, to continue the ‚€ pace in 2016. ƒ€€ ‚€€ † Deal PE multiples currently stand at their highest € since the financial crisis. The constituents of the € S&P Global 1200 consumer indices have spent ‹ $153.8 billion of cash on M&A over the last ƒ€€‰ ƒ€€Œ ƒ€‚€ ƒ€‚‚ ƒ€‚ƒ ƒ€‚„ ƒ€‚… T Š„ ƒ€‚† 12 reported months. The 2015 LTM revenues etail ood and everae Personal Žousehold oods remain stagnant and this could put pressure ecreation eisure Transportation nfrastructure on companies to divest their non-core product Employment Services PE deal multiples portfolios and focus on core markets and Source: Deloitte analysis based on data from Thomson One aner products. The consumer business sector is facing competition from non-traditional new entrants from the technology sector and this in turn could lead to participation in cross-industry strategic alliances and venture investments. Financial performance of the S&P Global 1200 Consumer Staples and Consumer Discretionary Indices constituents Financial performance of the S&P Global 1200 Consumer Staples and Consumer Discretionary Indices constituents Q4 2014 Q2 2015 Total revenues $762.7bn $710.7bn 2014 $7,0.6bn Consumer Cash and 2015 T $7,159.bn Business ST investments Total debt $2.4bn $.0bn $116.2bn $15.bn Cash sent Caital on € e enditure $171.4bn $169.9bn $156.bn $167.2bn $2,422.9bn $2,47.1bn Common Share dividends aid reurhases Note: LTM refers to the last tele months from the latest reported date Source: Deloitte analysis based on data from S&P Capital IQ
 Deloitte M&A Index | Report Page 20 Page 22