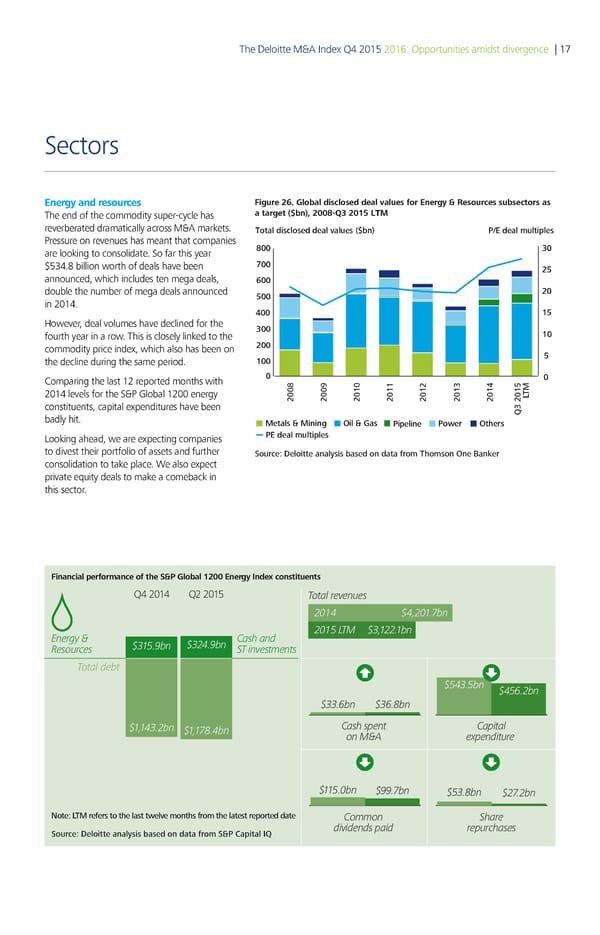
The Deloitte M&A Index Q4 2015 2016: Opportunities amidst divergence | 17 Sectors Energy and resources Figure 26. Global disclosed deal values for Energy & Resources subsectors as The end of the commodity super-cycle has a target ($bn), 200 20 € reverberated dramatically across M&A markets. Total disclosed deal values ($bn) P/E deal multiples Pressure on revenues has meant that companies ˆ ƒ are looking to consolidate. So far this year $534.8 billion worth of deals have been ‡ ‚… announced, which includes ten mega deals, † double the number of mega deals announced … ‚ in 2014. „ €… However, deal volumes have declined for the ƒ fourth year in a row. This is closely linked to the € commodity price index, which also has been on ‚ the decline during the same period. € … Comparing the last 12 reported months with 2014 levels for the S&P Global 1200 energy ‚ˆ ‚‹ ‚€ ‚€€ ‚€‚ ‚€ƒ ‚€„ ŠT constituents, capital expenditures have been ‰ƒ ‚€… badly hit. etals inin Oil as Pipeline Po er Others Looking ahead, we are expecting companies PE deal multiples to divest their portfolio of assets and further Source: Deloitte analysis based on data from Thomson One aner consolidation to take place. We also expect private equity deals to make a comeback in this sector. Financial performance of the S&P Global 1200 Energy Index constituents Q4 2014 Q2 2015 Total revenues $ €bn Energy & Cash and ƒTM $3 bn Resources $3bn $3 bn ST investments Total debt $3bn $„ bn $33„bn $3„‚bn $3 bn $€‚bn Cash spent Capital on M&A expenditure $bn $€bn $3‚bn $ € bn Note: LTM refers to the last tele months from the latest reported date Common Share Source: Deloitte analysis based on data from S&P Capital IQ dividends paid repurchases
 Deloitte M&A Index | Report Page 21 Page 23