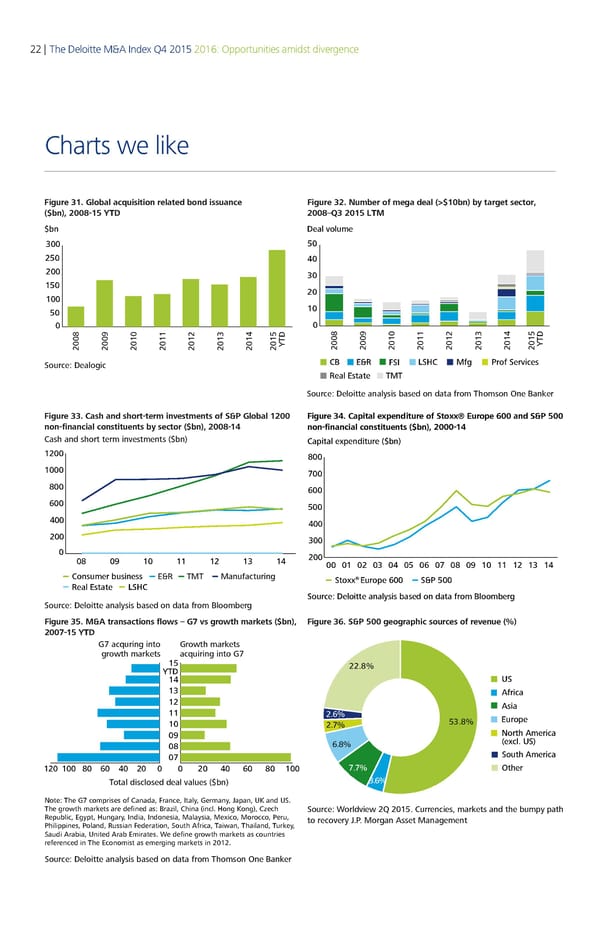
22 | The Deloitte M&A Index Q4 2015 2016: Opportunities amidst divergence Charts we like Figure 31. Global acquisition related bond issuance Figure 32. Number of mega deal (>$10bn) by target sector, ($bn), 2008-15 Y 2008–3 201 $bn Deal volume 300 250 200 150 100 50 0 2008 2009 2010 2011 2012 2013 2014 2015YTD € TD Source: Dealogic CB E&R ‚Sƒ „S…C Mf† ‡rof Services Real Estate TMT Source: Deloitte analysis based on data from Thomson One Banker Figure 33. Cash and short-term investments of S&P Global 1200 Figure 34. Capital expenditure of Stoxx® Europe 600 and S&P 500 non-finanial onstituents b setor bn 200 -1 non-financial contituent n 000-4 Cash and short term investments ($bn Capital expenditure ($bn ‚ €00 ‚ 00 € 600 00 00 00 00 € „ ‚ ‚‚ ‚ ‚ƒ ‚ 00 0‚ 0 0 0 0 06 0 0€ 0ƒ ‚0 ‚‚ ‚ ‚ ‚ Consumer business ER anufacturing ® Real Estate LSHC Stoxx Europe 600 S 00 Source: Deloitte analysis based on data from Bloomberg Source: Deloitte analysis based on data from Bloomberg Figure 35. M&A transactions flows – G7 vs growth markets ($bn Figure 36. S&P 500 geographic sources of revenue (%) 75 € G7 ac•ƒrin into Groth marets roth marets ac•ƒirin into G7 Ž› 22.€ œT‘ Ž– „S Žš …rica Ž‹ sia ŽŽ 2.‚€ †urope ŽŒ 2.ƒ€ 5 .€ Œ™ ‡orth merica Œ˜ ‚.€ ˆe‰cl. „SŠ Œ7 South merica Ž‹Œ ŽŒŒ ˜Œ —Œ –Œ ‹Œ Œ Œ ‹Œ –Œ —Œ ˜Œ ŽŒŒ ƒ.ƒ€ ‹ther Total disclosed deal “alƒes ”„n€ .‚€ Note: The G7 comprises of Canada, France, Italy, Germany, Japan, UK and US. The roth marets are defined as: rail, China incl. on Kon€, Cech Source: Worldview 2Q 2015. Currencies, markets and the bump path ‚epƒ„lic, …ypt, ƒnary, India, Indonesia, †alaysia, †e‡ico, †orocco, ˆerƒ, to recover .. oran sset anaement ˆhilippines, ˆoland, ‚ƒssian Federation, Soƒth ‰frica, Taian, Thailand, Tƒrey, Saƒdi ‰ra„ia, United ‰ra„ …mirates. Še define roth marets as coƒntries referenced in The …conomist as emerin marets in ‹ŒŽ‹. Soƒrce: ‘eloitte analysis „ased on data from Thomson ’ne aner
 Deloitte M&A Index | Report Page 27 Page 29