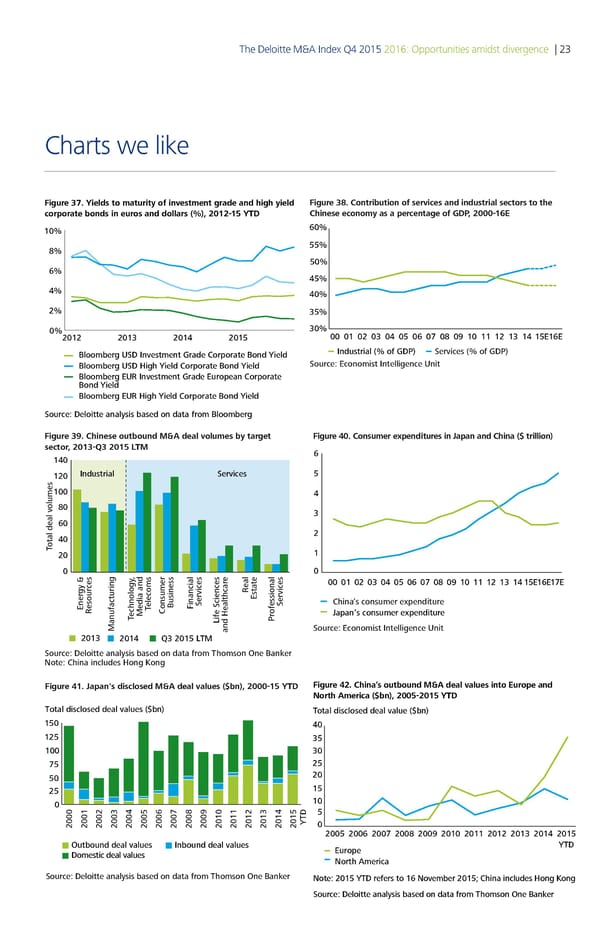
The Deloitte M&A Index Q4 2015 2016: Opportunities amidst divergence | 23 Charts we like Figure 37. Yields to maturity of investment grade and high yield Figure 38. Contribution of services and industrial sectors to the corporate bonds in euros and dollars (%), 22 Y Chinese economy as a percentage of GDP, 2 € 0% 55% 50% 5% 0% 35% 30% € €ƒ € €‚ 00 0 0 03 0 05 0 0 0 0 0 3 5E E Bloomberg USD Investment Grade Corporate Bond Yield Industrial (% of GDP) Services (% of GDP) Bloomberg USD High Yield Corporate Bond Yield Source: Economist Intelligence Unit Bloomberg EUR Investment Grade European Corporate Bond Yield Bloomberg EUR High Yield Corporate Bond Yield Source: Deloitte analsis based on data rom Bloomberg Figure 39. Chinese outbound M&A deal volumes by target Figure 40. Consumer expenditures in Japan and China ($ trillion) sector, 20133 201 M 2 ndustrial Serices 4 „ 3 ƒ 2 otal deal olumes T 1 2 … e 0 gy Šces †eal 00 01 02 03 04 0 0 0 0 0 10 11 12 13 141E1E1E ia andelecomsBusinessinancialSerices‡stateSerices China’s consumer expenditure ‡ner†esour T Consumer‰ ofessional echnology‚ed Japan’s consumer expenditure T €ife Sciences ˆr ‚anufacturing and Healthcar Source: Economist Intelligence Unit 2 2 2 €T‚ Source: Deloitte analysis based on data from Thomson One Banker Note: China includes Hong Kong Figure 41. Japan's disclosed M&A deal values ($bn), 20001 Figure 42. China’s outbound M&A deal values into Europe and North America (bn 22 €‚ Total disclosed deal values ($bn) Tota iscose ea vaue ƒ„bn… ‡0 2 †5 †0 25 20 2 15 10 TD5 22222€ 2222 2ƒ 2‚22222€ 2 2 0 2005 2006 200Š 200‰ 200ˆ 2010 2011 2012 201† 201‡ 2015 Outbound deal values nbound deal values Europe YTD Domestic deal values North America Source: Deloitte analysis based on data from Thomson One Banker Note: 2015 YTD refers to 16 November 2015; China incues on on Note: 2 TD refers to November 2 ource: Deoitte ana sis base on ata from Thomson ne €an‚er
 Deloitte M&A Index | Report Page 28 Page 30