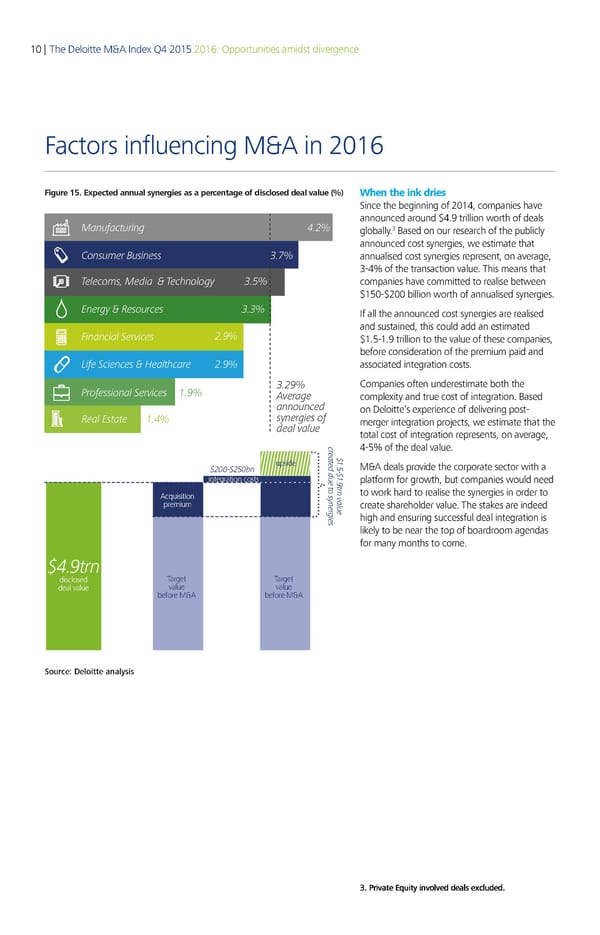
10 | The Deloitte M&A Index Q4 2015 2016: Opportunities amidst divergence Factors influencing M&A in 2016 Figure 15. Expected annual synergies as a percentage of disclosed deal value (%) When the ink dries Since the beginning of 2014, companies have announced around $4.9 trillion worth of deals Manufacturing 3 globally. Based on our research of the publicly announced cost synergies, we estimate that Consumer Business annualised cost synergies represent, on average, 3-4% of the transaction value. This means that Telecoms, Media & Technology companies have committed to realise between $150-$200 billion worth of annualised synergies. Energy & Resources If all the announced cost synergies are realised and sustained, this could add an estimated inancial Services € $1.5-1.9 trillion to the value of these companies, before consideration of the premium paid and Life Sciences & Healthcare € associated integration costs. Professional Services ƒ€ € Companies often underestimate both the ‚verage complexity and true cost of integration. Based announced on Deloitte’s experience of delivering post- Real Estate ƒ synergies of merger integration projects, we estimate that the deal value total cost of integration represents, on average, c r 4-5% of the deal value. e a „ t ƒ upside e d d M&A deals provide the corporate sector with a „……†„…‡n † „ u ƒ integration costs e t € platform for growth, but companies would need t o sr Acquisition y n v to work hard to realise the synergies in order to n a e l premium r u create shareholder value. The stakes are indeed g e i e high and ensuring successful deal integration is s likely to be near the top of boardroom agendas for many months to come. „€trn disclosed Target Target deal value value value before M&A before M&A Source: Deloitte analysis 3. Private Equity involved deals excluded.
 Deloitte M&A Index | Report Page 10 Page 12