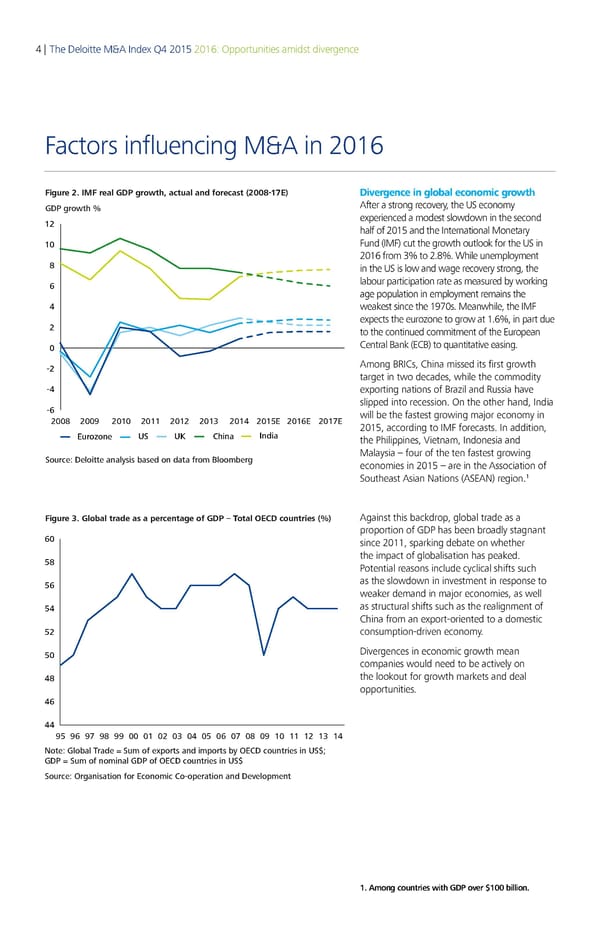
4 | The Deloitte M&A Index Q4 2015 2016: Opportunities amidst divergence Factors influencing M&A in 2016 Figure 2. IMF real GDP growth, actual and forecast (2008-1 Divergence in global economic growth ‚Dƒ €ro„h … After a strong recovery, the US economy 12 experienced a modest slowdown in the second half of 2015 and the International Monetary 10 Fund (IMF) cut the growth outlook for the US in 2016 from 3% to 2.8%. While unemployment 8 in the US is low and wage recovery strong, the 6 labour participation rate as measured by working age population in employment remains the 4 weakest since the 1970s. Meanwhile, the IMF expects the eurozone to grow at 1.6%, in part due 2 to the continued commitment of the European 0 Central Bank (ECB) to quantitative easing. -2 Among BRICs, China missed its first growth target in two decades, while the commodity -4 exporting nations of Brazil and Russia have slipped into recession. On the other hand, India -6 will be the fastest growing major economy in 2008 2009 2010 2011 2012 2013 2014 2015E 2016E 2017E 2015, according to IMF forecasts. In addition, Eurozone US UK China India the Philippines, Vietnam, Indonesia and Source: Deoie anai aed on daa ro oo er€ Malaysia – four of the ten fastest growing economies in 2015 – are in the Association of 1 Southeast Asian Nations (ASEAN) region. Figure 3. Global trade as a percentage of GDP – Total OECD countries (%) Against this backdrop, global trade as a proportion of GDP has been broadly stagnant 60 since 2011, sparking debate on whether 58 the impact of globalisation has peaked. Potential reasons include cyclical shifts such 56 as the slowdown in investment in response to weaker demand in major economies, as well 54 as structural shifts such as the realignment of China from an export-oriented to a domestic 52 consumption-driven economy. 50 Divergences in economic growth mean companies would need to be actively on 48 the lookout for growth markets and deal opportunities. 46 44 95 96 97 98 99 00 01 02 03 04 05 06 07 08 09 10 11 12 13 14 ote: o a rae € Sum of e‚ports an imports ƒ OEC countries in „S…† ‡ € Sum of nomina ‡ of OEC countries in „S… Source: Organisation for Economic Co-operation an eeopment 1. Among countries with GDP over $100 billion.
 Deloitte M&A Index | Report Page 4 Page 6