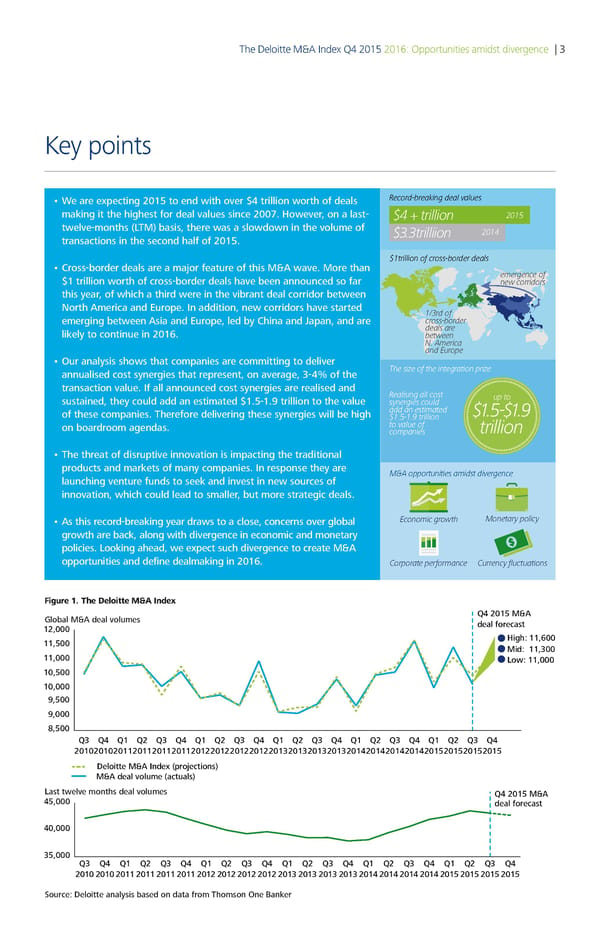
The Deloitte M&A Index Q4 2015 2016: Opportunities amidst divergence | 3 Key points • We are expecting 2015 to end with over $4 trillion worth of deals Record-breaing deal alues making it the highest for deal values since 2007. However, on a last- $ trillion 15 twelve-months (LTM) basis, there was a slowdown in the volume of $3.3trilliion 1 transactions in the second half of 2015. $1trillion of cross-border deals • Cross-border deals are a major feature of this M&A wave. More than emergence of $1 trillion worth of cross-border deals have been announced so far new corridors this year, of which a third were in the vibrant deal corridor between North America and Europe. In addition, new corridors have started 1/3rd of emerging between Asia and Europe, led by China and Japan, and are cross-border likely to continue in 2016. deals are between N. America and Europe • Our analysis shows that companies are committing to deliver €e si‚e of te integration pri‚e annualised cost synergies that represent, on average, 3-4% of the transaction value. If all announced cost synergies are realised and Realising all cost sustained, they could add an estimated $1.5-1.9 trillion to the value synergies could up to of these companies. Therefore delivering these synergies will be high add an estimated $1.5-$1. $1.5-1. trillion on boardroom agendas. to alue of trillion companies • The threat of disruptive innovation is impacting the traditional products and markets of many companies. In response they are ƒ„A opportunities amidst diergence launching venture funds to seek and invest in new sources of innovation, which could lead to smaller, but more strategic deals. • As this record-breaking year draws to a close, concerns over global Economic growt ƒonetary policy growth are back, along with divergence in economic and monetary policies. Looking ahead, we expect such divergence to create M&A opportunities and define dealmaking in 2016. …orporate performance …urrency fluctuations Figure 1. The Deloitte M&A Index lo al M&A deal volumes Q4 2015 M&A 12000 deal orecast 11500 Ši‹„€ 11Œ00 Mid€ 1100 11000 ˆo‰€ 11000 10500 10000 500 000 500 Q Q4 Q1 Q2 Q Q4 Q1 Q2 Q Q4 Q1 Q2 Q Q4 Q1 Q2 Q Q4 Q1 Q2 Q Q4 201020102011201120112011201220122012201220120120120120142014201420142015201520152015 Deloitte M&A Index (projections) M&A deal volume (actuals) ˆast t‰elve mont„s deal volumes Q4 2015 M&A 45000 deal orecast 40000 5000 Q Q4 Q1 Q2 Q Q4 Q1 Q2 Q Q4 Q1 Q2 Q Q4 Q1 Q2 Q Q4 Q1 Q2 Q Q4 20102010 2011 201120112011201220122012201220120120120120142014201420142015201520152015 ource€ Deloitte anal‚sis ased on data rom ƒ„omson …ne †an‡er
 Deloitte M&A Index | Report Page 2 Page 4